Figures & data
Table 1. Characteristic features of study populations.
Figure 1. Transcriptomic characterization of CD4+ TILs of CRC patients. RNA-Seq was performed on CD4+ TILs isolated from 18 CRC tissues at different disease stages. Flow cytometric plots illustrate the gating strategy to isolate CD4+ TILs with high purity (a). Volcano plot showing significantly (P < 0.05) upregulated (red) and downregulated transcripts (green) from advanced (stage III & IV) vs. early (I & II) stages of CRC (b). Comparisons of selected differentially expressed gene panels including immune checkpoints, Th-, Treg- and Tex-related genes from advanced (A) vs. early (e) comparison. Volcano plot and heat map (Z-scores) showing the differential expression of significantly (P < 0.05) upregulated or downregulated genes in advanced vs. early stages of CRC (c). Bar plots illustrating the functional characterization of significantly upregulated and downregulated genes from advanced vs. early stages of CRC (d). Heat maps of the differential expression of genes from selected upregulated or downregulated pathways (e).
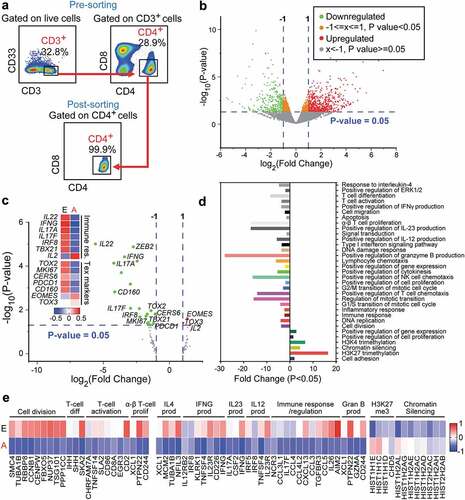
Figure 2. KEGG/Gene ontology pathway enrichment analyses of deregulated genes from stage-wise comparison. Differentially expressed genes from stage-wise comparisons were analyzed using the DAVID platform to identify functional pathways enrichment in stage III or IV compared to stage I or II, and in advanced stage (A: III and IV) vs. early stage (E: I and II). Charts showing significantly downregulated KEGG pathways enriched in each comparison with percentage of the number of enriched genes for each pathway to the total number of genes (a). Venn diagrams showing the shared pathway and the pathway lists which were enriched in the downregulated genes (b) and upregulated genes (c). The alphabets in the Venn diagrams represent the shared gene ontology clusters listed in the tables.
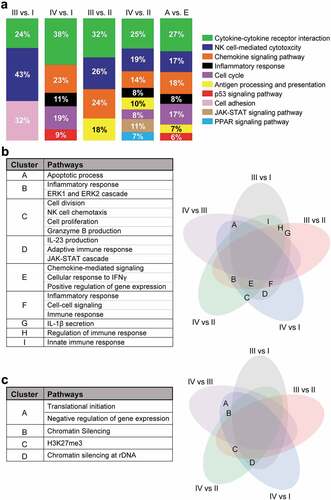
Figure 3. Transcriptomic characterization of steadily deregulated genes across stages of CRC. Significantly upregulated (a) and downregulated genes (b) which were deregulated in an order with staging were used for further analyses on DAVID platform. Heat maps show the expression (Z-scores) of 51 upregulated and 134 downregulated genes. Bar plots show the fold change of each functional pathways, which were significantly upregulated and downregulated from gene ontology enrichment analyses (c). Heat map showing the expression of genes (Z-scores) discovered in the selected functional network from panel C (d).
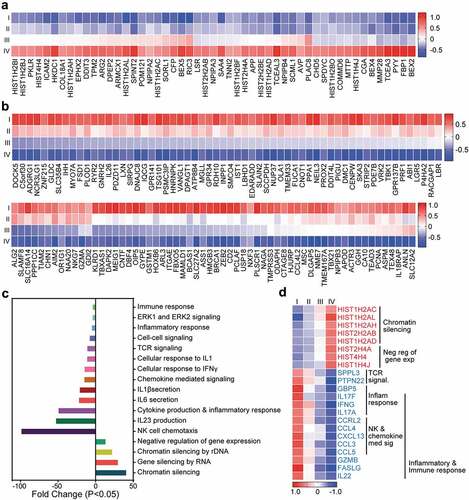
Figure 4. PPI network analyses of deregulated genes in advanced stage of CRC. PPI network analyses using the STRING database of significantly upregulated (a) and downregulated (b) genes obtained from analyses of advanced stages vs. early stages. The unconnected nodes were removed from the networks. GO ontologies, description and false discovery rate (FDR) using the whole transcriptome as reference are stated for each subnetwork. The overall network statistics are shown in the gray boxes.
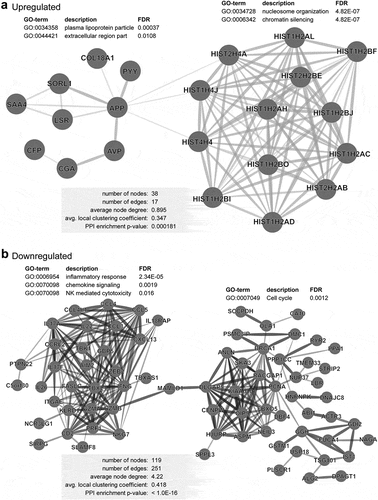
Figure 5. Evaluating of the prognostic relevance of “poor prognosis CD4+ TIL gene signature” in TCGA CRC dataset. The selected genes as described in Methods were used to calculate the ‘poor prognosis CD4+ TIL gene signature’ (ppCD4sig) score; calculated as the ratio of the average expression of the 43 upregulated genes to the average of the 64 downregulated genes. The ppCD4sig was evaluated in TCGA CRC RNA-Seq dataset. Disease-specific survival (a) and progression-free interval (b) were compared between patients with high (top 33%), intermediate (middle 33%) or low (bottom 33%) ppCD4sig scores. The number (n) of patients in each of ppCD4sig groups and the log-rank P value from Mantel-Cox test are indicated. Multivariate analyses, using Cox proportional-hazard model, comparing the ppCD4sig (high, interm, low), disease stage (stages IV, III, II, I), residual disease (yes, no), age (<55, 55–64, 65–74, >74 years of age), anatomic locations (7 different locations), and sex (male, female). Multivariate analysis was done for disease-specific survival (c) and progression-free interval (d). Data shown are the hazard ratio (HR) ± 95% confidence interval (CI), and the multivariate P values are indicated (n.s.: not significant). Distribution of patients with high, intermediate, or low sCD4sig scores across diseases stage (e) or age at diagnosis (f). Stated P-values are from Chi-square (χ2) test (GraphPad Prism).
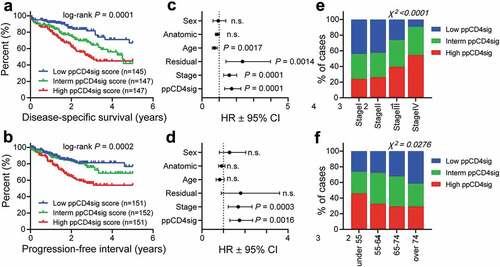
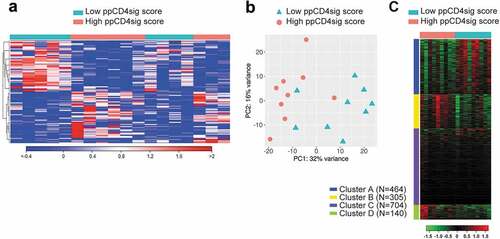
Figure 6. Transcriptomic analyses of high ppCD4sig score vs. low score for CRC patients. The ppCD4sig score for the 18 patients was calculated based on the ratio between the average expression (TPM) of upregulated genes to the average expression of downregulated genes. Patients were dichotomized as high score (above median score) and low score (below median score) groups. Differential expression analyses were performed on data comparing high score vs. low score patients to identify deregulated and functional networks using iDEP platform. Hierarchical heat map shows the distinct cluster of high score and low score patient groups (FC >2 and P value < 0.05) (a). PCA plot showing the variability in gene expression between high score and low score CRC patients. First two principal components are shown (b). Heat map shows the four functional clusters from gene ontology enrichment analyses (c). Expression of clustered transcripts is depicted as color code, displayed below the heat map. The number of genes annotated in each cluster is represented (left side) of the heat map.