Figures & data
Figure 1. Construction of the ISNSCLC by the LASSO model. LASSO coefficient profiles of 20 significant immune features with the top 20 smallest P-values in LUAD training cohort (a) and LUSC training cohort (d). For tuning parameter selection in the LASSO model, by 10-time cross-validation via 1-SE criteria, λ = 0.194 was chosen in LUAD training cohort (b), and λ = 0.283 was chosen in LUSC training cohort (e). Representative multiplex fluorescent immunohistochemistry images show the final features enrolled in ISLUAD (c) and in ISLUSC (f). Bar, 100 µm. IS, immunological score; NSCLC, non-small cell lung cancer; LUAD, lung adenocarcinoma; LUSC, lung squamous cell carcinoma; CT, the core of tumor; IM, invasive margin.
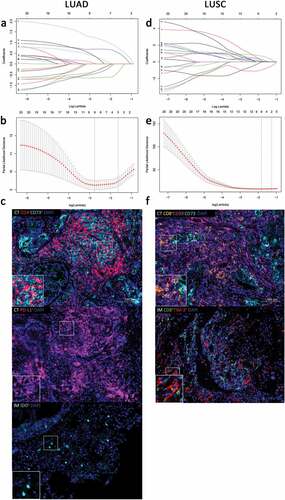
Figure 2. ISNSCLC performance in time-dependent ROC curves and Kaplan–Meier survival analyses in different cohorts. (a) LUAD training cohort. (b) LUAD validation cohort. (c) LUSC training cohort. (d) LUSC validation cohort. AUCs at 1, 3, and 5 y were used to assess prognostic accuracy. P-values were calculated by the log-rank test. DFS, disease-free survival; OS, overall survival; ROC, receiver operator characteristic; AUC, area under the curve.
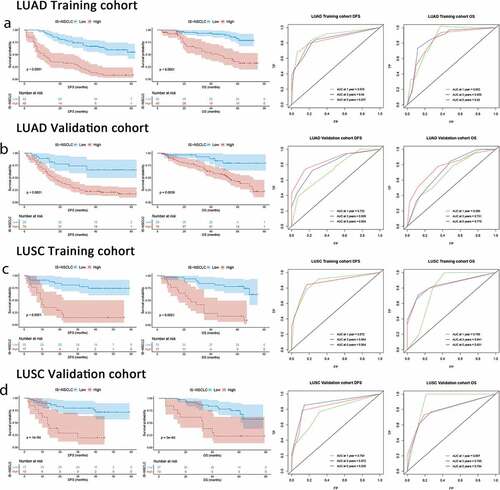
Table 1. Multivariable Cox regression analyses of the ISNSCLC, clinicopathological characteristics, and survival.
Figure 3. Kaplan–Meier survival analysis stratified by the TNM stages. Kaplan–Meier survival analysis of DFS and OS for all the NSCLC patients according to the ISNSCLC stratified by the TNM stages. P-values were calculated by the log-rank test. (a) Stage I LUAD. (b) Stage I LUSC. (c) Stage II LUAD. (d) Stage II LUSC. (e) Stage III LUAD. (f) Stage III LUSC.
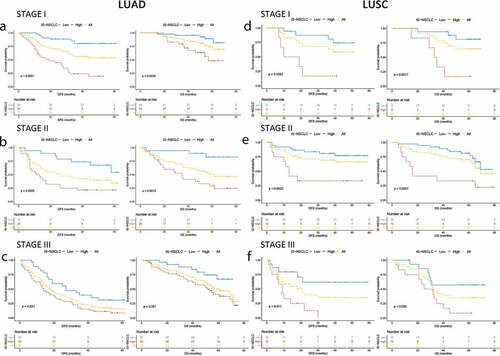
Figure 4. From TNM to TN-I. DFS curves of LUAD/LUSC patients according to ISNSCLC (a, b) and TNM stage (c, d). Patients were grouped into three groups (e, f) according to the combination of TNM stage (t, n) and ISNSCLC (i) (T-N-I risk score) by survival (3-y DFS, <20%, 20%-70%, and >70%; 5-y OS, <30%, 30%-70%, and >70%), resulting into a TN-immunological score (TN-I) staging table (g), adding significant prognostic impact to each TNM stage. ROC curves show the comparisons of the area under the curve of TN-I stage, ISNSCLC, and the ISNSCLC classifier (high vs. low) with TNM stage and the IS proposed by SITC in LUAD cohort (h) and LUSC cohort (I). SITC, the Society for Immunotherapy of Cancer.
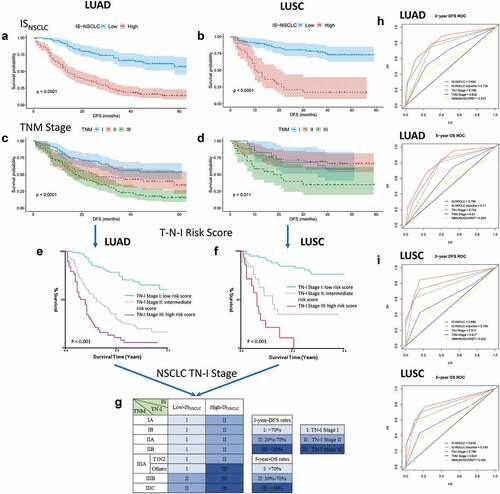
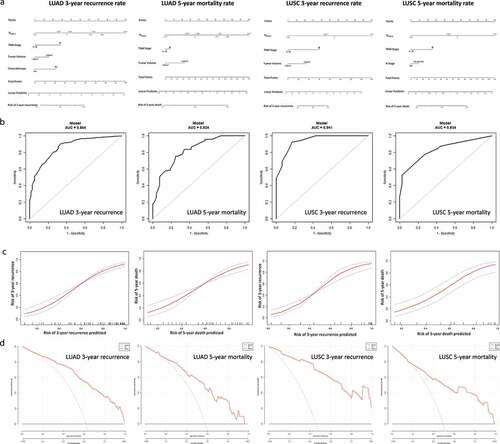
Figure 5. Nomograms for predicting the 3-y recurrence and 5-y mortality rate after surgery in NSCLC patients. Nomograms (a) are showed at the top. Receiver operator characteristic curves (b) exhibit the prediction accuracy of each nomogram model. Model performance is shown by calibration plots (c) depicting the agreement between predicted and observed probabilities of each model. Decision curve analysis (d) shows the net clinical benefit of the nomograms.