Figures & data
Figure 1. Anti-tumor effect of dual PD1/VISTA blockade in 4T1 tumor-bearing mice requires radiotherapy and pre-treatment with cyclophosphamide
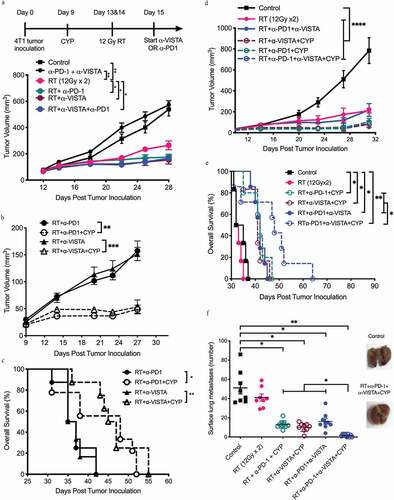
Figure 2. Changes in tumor infiltration by CD8+ T cells induced following the different treatments. 4T1 tumor-bearing mice were treated as described in ). On day 18 post 4T1 cell injection, tumors were excised and digested and single-cell suspensions analyzed by flow cytometry. (a) A multi-step gating strategy was employed to identify CD8+ TILs in dissociated tumors. Positive populations were identified based on negative staining on fluorescence-minus-one (FMO) controls. (b) Percentage of CD8+ T cell infiltration. (c) CD69 expression in CD8+ T cells and (d) percentage of CD8+ TILs expressing PD-1. (b-d, *p< .05, **p< .005, ***p< .0005, ****p< .0001, one-way ANOVA). (e) Effect of treatment on tumor-specific IFN-γ response in tumor-draining lymph nodes. Dissociated cell suspensions were incubated with peptides (tumor-specific epitope AH-1-A5) or irrelevant peptide pMCMV and IFN-γ production measured 48 hours later by ELISA. Each symbol represents the response of an individual mouse to tumor epitope AH-1-A5 after subtraction of the background response to pMCMV (****p< .0005, one-way ANOVA). (f) Percentage of CD4 + T cell infiltration. (g) Proportion of CD4+CD25+FOXP3+ regulatory T (TREG) cells in the CD4 compartment. (h) Expression of CD25 among effector CD4+ T cells. (*p< .05, one-way ANOVA)
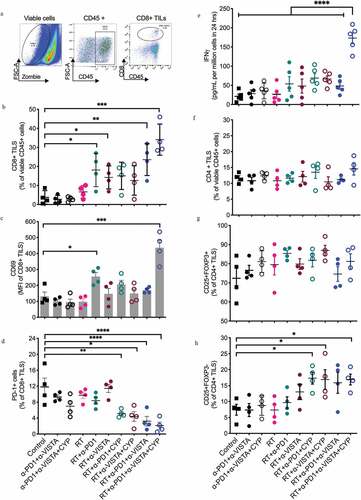
Figure 3. Changes in tumor infiltration by MDSC induced following the different treatments. 4T1 tumor-bearing mice were treated as described in Figure 1A. On day 18 post 4T1 cell inoculation, tumors were excised and digested and single-cell suspensions analyzed by flow cytometry. Samples were gated on viable CD45+ cells. (a) Representative histograms show surface expression of VISTA in monocytic and granulocytic MDSCs. Gates were drawn based on negative staining of fluorescence-minus-one (FMO) control. (b) Percentage of CD11b+ cells in 4T1 tumors of mice in each treatment group. (c) Percentage of granulocytic MDSCs among CD11b+ cells. (d) Percentage of monocytic MDSCs among CD11b+ cells. (*p< .05, **p< .005, one-way ANOVA)
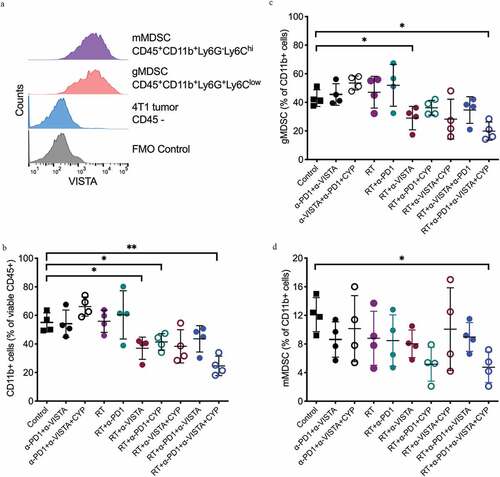
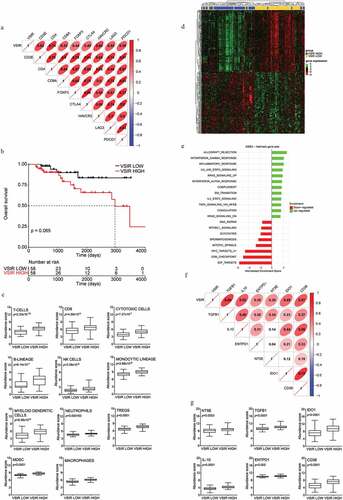
Figure 4. VISTA expression in human TNBC correlates with immunoactivation and immunoregulatory gene signature. (a) Correlation between VSIR gene expression and expression levels of eight selected immune genes in TNBC (TCGA-BRCA) cohort. The correlation coefficient is displayed. (b) Overall survival of 116 TNBC patients from the TCG-BRCA database stratified based on median expression level of VSIR gene. (c) Relative expression levels of gene sets associated with T-cells, CD8 cells, Cytotoxic cells, B cells, natural killer (NK) cells, TH1 cells, monocytes, myeloid dendritic cells, neutrophils, regulatory T (TREGS) cells, myeloid-derived suppressor cells (MDSC) and macrophages between VSIR LOW and VSIR HIGH patients from TNBC (TCGA-BRCA) cohort. Box plots: lower quartile, median, upper quartile; whiskers, minimum, maximum. (d) Unsupervised hierarchical clustering of differentially expressed genes that were significantly changed (adjusted p-value <0.05) in VSIR HIGH versus VSIR LOW patients in TNBC (TCGA-BRCA) cohort. (e) GSEA Bar plot for enriched GSEA HALLMARK categories. Only categories with adjusted p < .05 were considered significant. Bar plot depicting the normalized enrichment scores of the most positively (green) and negatively (red) enriched categories in VSIR HIGH patients. (f) Correlation between VSIR gene expression and expression levels of immunoregulatory genes for TNBC cohort in the TCGA-BRCA dataset. The correlation coefficient is displayed. (g) Relative expression levels of immunoregulatory genes between VSIR LOW and VSIR HIGH group of patients from TNBC (TCGA-BRCA) cohort. Box plots: lower quartile, median, upper quartile; whiskers, minimum, maximum