Figures & data
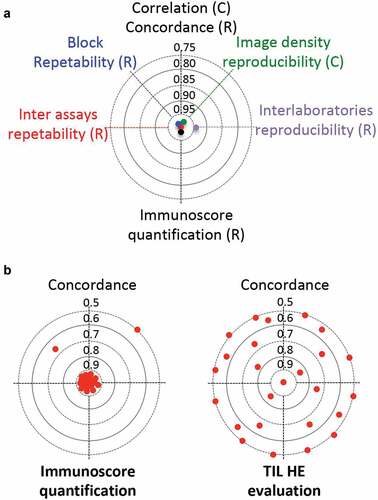
Figure 1. Immunoscore analytical validation. (a) Inter-assay repeatability, block repeatability, image density reproducibility, inter-laboratories reproducibility and Immunoscore concordance. (b) Representative cases (n = 36) of the whole international SITC cohort were taken from centers in Belgium, Canada, China, France, and USA, and were re-analyzed by 8 independent pathologists from different centers, using the Immunoscore digital pathology software (left). The reproducibility of the results of the Immunoscore were compared with that of a visual assessment of the density of tumor-infiltrating immune cells in tumor tissue stained with hematoxylin and eosin (HE). HE-images from representative cases (n = 268) from the international SITC cohort were visually assessed by 11 observers the density of tumor-infiltrating immune cells (right). Concordance index is visualized for 25 representative cases (red dots)