Figures & data
Figure 1. The assessment of PD-L1 expression using immunohistochemistry (IHC) staining in formalin-fixed paraffin-embedded (FFPE) tissue samples shows several limitations inherent to the tissue sampling, IHC detection methods and used antibodies. Circulating ICs could represent more dynamic biomarkers and be useful to predict the effect of the anti-PD-1 monoclonal antibody against RCC
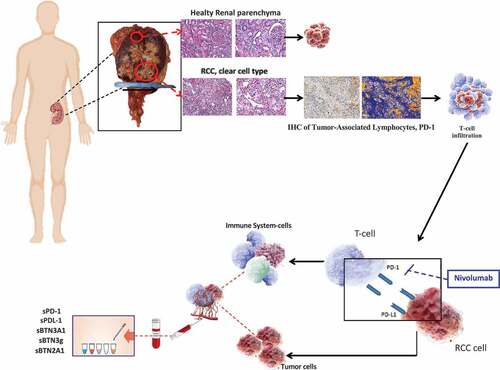
Table 1. Clinical and pathological features of localized RCC patients
Table 2. Clinical and pathological features of metastatic RCC patients
Table 3. Median and range of pretreatment (T0) levels of plasmatic ICs in all mccRCC patients and in long-responders (>18 months) group
Figure 2. PFS (months) to nivolumab treatment in mccRCC patients (a); mean value of plasmatic ICs levels in all nivolumab patients versus long-responders patients (>18 months) (b, c–f)
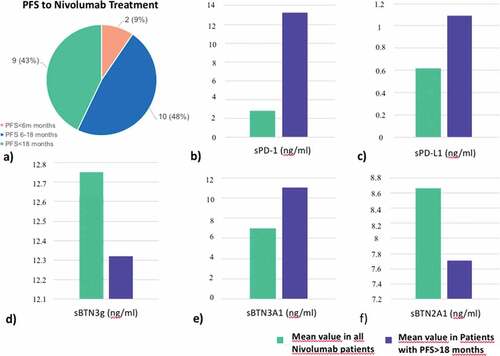
Figure 3. Kaplan-Meier analysis of progression free survival in patients from learning cohort with high and low plasma levels of sPD-1 (a), sPD-L1 (b), and sBTN3A1 (c)
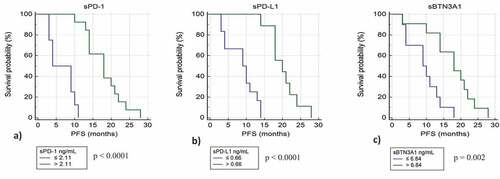
Table 4. Association of sIC with best overall response by RECIST (BOR) and objective response of >20% (OR)
Table 5. Association between baseline plasma ICs levels and number of metastatic sites, localization of metastasis and IMDC Prognostic Risk Group
Figure 4. Comparison T0-T1 of ICs levels in the plasma of mccRCC long responders patients treated with nivolumab
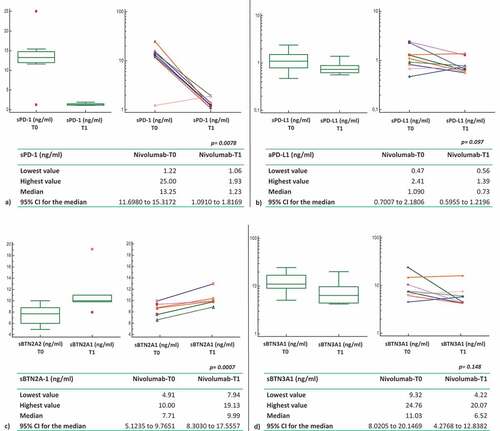
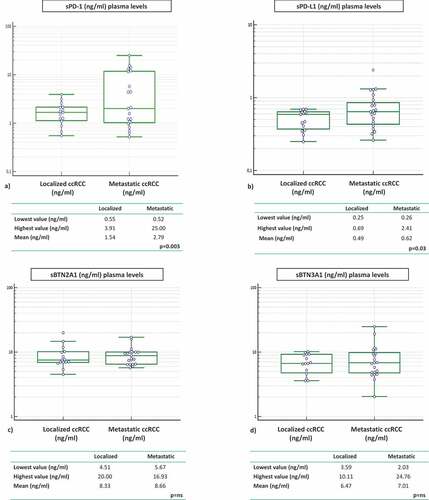
Figure 5. ICs in RCC patients: localized vs metastatic disease at baseline (pretreatment)