
Figures & data
Table 1. The three levels of response according to their assumed clinical relevance and reliability of the study endpoints (Table 1)
Table 2. Overview of level 2 preclinical studies according to the search criteria
Table 3. Overview of level 3 preclinical studies according to the search criteria
Figure 1. Flowchart of studies, which were identified by the literature search, screened excluded or included from analysis
Figure 2. The radiotherapy sensitizing effect of Immunotherapy is compared between different studies: therefore tumor growth delay(TGD) was calculated and used to define the Radiation Enhancement factor (REF) between radiotherapy combined with immunotherapy and radiotherapy alone. The X axis displays the various classes of immunotherapies used in the studies: (1) anti-PD-(l)-1, (2) CTLA4, (3) cytokines: r-IL-2, (4) Vaccination / Dendritic cells, (5) CPG / Toll-like receptor, and (6) others. The Y-axis represents the value of the REF, from 0 to 90. The blue-dashed line is a REF value of 1, meaning RT + immunotherapy has the same effect as RT solely. Every dot represents a single calculated REF of one preclinical study. Several dots are calculated per study. A horizontal line represents the mean REF per immunotherapy. A green dot represents the calculated REF’s based on survival curves or on response rates: these are based on the volume of the last day of follow-up because the tumor was progression free. Therefore these dots are a minimal representation of the REF because in reality it concerns a higher REF
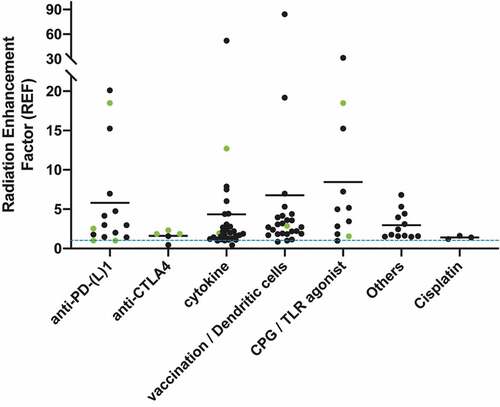
Table 4. Overview of clinical studies according to the search criteria