
Figures & data
Figure 1. Evaluation of tumor infiltrating CD11b+ cells. (a-d) Representative immunohistochemical images of tumor infiltrating leukocytes (a) and CD11b+ cells (c) and respective negative controls (b and (d). Primary tumors obtained from A/J mice inoculated subcutaneously with NXS2-HGW NB cells were stained with either anti-CD45- (A) or anti-CD11b Ab (C) for detection of leukocytes and CD11+ cells, respectively. Magnification of 100 ×. (e) Gating strategy of flow cytometric analysis of CD11b+ cell subsets (GD2−/CD45+/CD11b+). A dot plot of GD2 and CD45 expression showing a living cell fraction (left) was used to define a GD2−/CD45+ cell population that was next characterized in terms of CD11b expression (open black curve) using a histogram (right). Isotype Ab served as a negative control (filled gray curve). (f) Quantitative analysis of leukocytes and CD11b+ cells infiltrating primary tumors in untreated mice (0.9% NaCl; white columns). Leukocytes were calculated as a percent of the viable GD2-negative CD45-positive cells relative to all viable cells detected in primary tumor tissue. Two subsets of CD11b+ (CD11b+ cells (CD11b+) and cells showing high expression of CD11b (CD11bhigh)) were calculated as a percent of viable GD2−/CD45+/CD11b+ cells relative to all viable leukocytes detected in tumor tissue
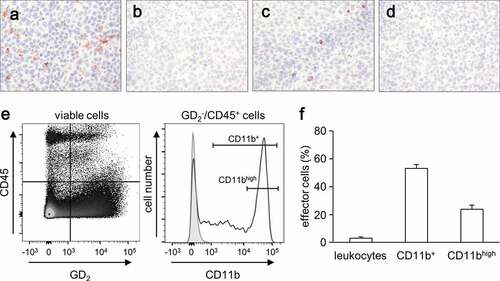
Figure 2. Effects of ADCC culture conditions on cytokine production by human NB cells and leukocytes. Concentrations of the cytokines M-CSF, GM-CSF, CCL2 and CCL20 (upper panel), TGF-β, VEGF, IFN-γ and IL-1β (middle panel) and IL-4, IL-6, IL-8 and IL-10 (lower panel) were determined by flow cytometry in supernatants 24 h after induction of GD2-directed ADCC in the presence or absence of IL-2. Rituximab served as control. Data represent mean values ± SEM of at least two independent experiments. Statistical analysis was performed with ANOVA followed by appropriate post hoc comparison test. To show IL-2-dependent impact on cytokine production, t-test was used. *P < .05 vs. LAN-1, **P < .01 vs. LAN-1, ***P < .001 vs. LAN-1, §P < .05 vs. leukocytes, §§P < .01 vs. leukocytes, §§§P < .05 vs. leukocytes, ##P < .01 vs. ADCC
Figure 3. Antitumor effects of the ch14.18/CHO treatment in combination with reduction of suppressive myeloid cells in vivo. (a) Schematic overview of the treatment protocol. Four days after tumor cell injection, mice received either ch14.18/CHO or anti-CD11b Ab or 5-FU or combination of ch14.18/CHO and 5-FU. (b) Analysis of tumor growth in mice treated with either anti-CD11b Ab (open squares) or 5-FU (open circles). Controls received 0.9% NaCl (closed squares). Data are shown as mean values ± SEM. Statistical analysis of differences between anti-CD11b and control, 5-FU and control as well anti-CD11b and 5-FU groups was performed with one-tailed t-test: *P < .05 for 0.9% NaCl vs. anti-CD11b; §P < .05, §§P < .01, §§§P < .001 for 0.9% NaCl vs. 5-FU; #P < .05, ##P < .01 for anti-CD11b vs. 5-FU. (c) Analysis of tumor infiltrating effector cells of mice treated with anti-CD11b Ab (anti-CD11b, black columns) or 5-FU (5-FU, gray columns) in comparison with the untreated controls (0.9% NaCl, white columns). Leukocytes shown in % of all viable CD45+/GD2− cells and CD11b+ cells shown in % of all viable CD45+/CD11b+/GD2− cells were assessed in tumor tissue using flow cytometry analysis. To show impact of anti-CD11b and 5-FU treatments on effector cell count, t-test was used. ***P < .001 vs. 0.9% NaCl. (d) Analysis of tumor growth in mice treated with either ch14.18/CHO alone (gray circles) or ch14.18/CHO in combination with 5-FU (closed circles). Controls received 0.9% NaCl (closed squares). Data are shown as mean values ± SEM. Statistical analysis of differences between ch14.18/CHO and control, combined treatment (ch14.18/CHO + 5-FU) and control as well as combined treatment (ch14.18/CHO + 5-FU) and 5-FU groups was performed with one-tailed t-test: *P < .05, *P < .01, *P < .001 for 0.9% NaCl vs. ch14.18/CHO group; #P < .05 for ch14.18/CHO vs. combined treatment group (ch14.18/CHO + 5-FU); §P < .05, §§P < .01, §§§P < .001 for 0.9% NaCl vs. combined treatment group (ch14.18/CHO + 5-FU)
Figure 4. Analysis of 5-FU impact on viability of tumor and effector cells in vitro. To analyze direct 5-FU impact on the viability of NB and effector cells, NXS2-HGW cells served for tumor establishment (closed circles) and leukocytes isolated from spleens of healthy mice (open circles) were incubated with six different 5-FU concentrations in the range of 6–1500 µg/ml followed by analysis of cell viability with XTT-based viability assay. Data represent mean values ± SEM of at least three independent experiments. When error bars are not visible they are covered by the symbol. Differences between the groups were statistically not significant. Kruskal-Wallis one way analysis of variance on Ranks
Figure 5. Impact of the ch14.18/CHO treatment and reduction of suppressive myeloid cells on survival and gene expression. The GD2 expressing murine NB cells NXS2-HGW were injected subcutaneously into A/J mice followed by the treatment with the chimeric anti-GD2 Ab ch14.18/CHO, anti-CD11b Ab, 5-FU, or combination of ch14.18/CHO and 5-FU. (a) Comparison of OS probabilities of mice treated with either ch14.18/CHO alone (black dashed line) or 5-FU alone (gray dashed line) or ch14.18/CHO in combination with 5-FU (black solid line) with control mice (0.9% NaCl, gray solid line). Death ahead of schedule and a tumor volume of 750 mm3 were defined as event. LogRank test. *P < .05 vs. ch14.18/CHO, ***P < .001 vs. 5-FU, $$$P < .001 vs. 0.9% NaCl, #P < .05 vs. 0.9% NaCl. (b) Comparison of mRNA expression levels of suppressive myeloid cell-associated and modulating genes between primary tumor tissue and NB cells NXS2-HGW used for tumor establishment. Tumor samples were collected from tumor bearing mice treated with ch14.18/CHO, anti-CD11b, 5-FU, or ch14.18/CHO in combination with 5-FU as well as control mice. Expression levels of Arg1, IL-1β, IL-10, CCL2, NOS2, IFN-γ, M-CSFr, IL-6 r, IL-8, IDO, GM-CSF, IL-4, M-CSF, IL-6, TGF-β1, and VEGF-A were determined using RT-PCR analysis relative to the internal control GAPDH and are represented as colors. The color spectrum between light- and dark gray was used to represent the different levels of expression with light gray for low- and dark gray for high expression of the respective gene. Statistical analysis of expression level differences between anti-CD11b and control, 5-FU and control, anti-CD11b and 5-FU as well as ch14.18/CHO and ch14.18/CHO in combination with 5-FU groups was performed with one-tailed t-test: *P < .05 vs. 0.9% NaCl, #P < .05 vs. anti-CD11b
Figure 6. Comparison of gene expression in high- and low volume tumors. To show impact of a tumor volume on mRNA gene expression, samples from tumors showing high- (>600 mm3, black columns) and low volumes (<500 mm3, white columns) were analyzed with RT-PCR analysis. Expression levels of mRNA were determined relative to the internal control GAPDH. Data are shown as mean of relative mRNA expression from at least three independent experiments
Table 1. PCR conditions and primer sequences of CD11b+ myeloid cell-associated and modulating genes. To investigate mRNA expression of CD11b+ myeloid cell-associated and modulating genes in tumor tissue and the neuroblastoma cells NXS2-HGW, RT-PCR analysis was used