Figures & data
Table 1. Ovarian cancer patient characteristics and DNAM-1/TIGIT expression profile
Figure 1. NK cell phenotype of the DNAM-1/TIGIT/CD96 pathway in healthy donors and ovarian cancer patients. (a) DNAM-1, TIGIT and CD96 expression of healthy donor (HD) peripheral blood and OC patient ascites-derived CD56dim and CD56bright NK cells of a representative HD and OC patient, respectively. In grey the isotype control and in black the marker of interest are depicted. Numbers in the plot represent the median fluorescence intensity. (b) DNAM-1, TIGIT and CD96 expression on CD56dim and CD56bright NK cells of 10 HDs and 9 OC patients. Data is shown as mean+SEM. Kruskal-Wallis with Dunn’s Multiple Comparison Test was used for statistical analysis, * p < 0.05, ** p < 0.01 and *** p < 0.001. (c) DNAM-1, TIGIT and CD96 expression in 5 NK subsets, defined by characteristic CD56 and CD16 expression patterns, of 11 benign peritoneal fluids (bottom three panels) and 9 malignant ascites (top three panels). Datapoints with less than 100 events are excluded from the graphs. For a detailed number of cells per datapoint refer to Supplemental fig 1G. Kruskal-Wallis with Dunn’s Multiple Comparison Test was used for statistical analysis, * p < 0.05, ** p < 0.01*** and p < 0.001. (d) Co-expression patterns were determined with SPICE software. The pies depict the average proportion of cells expressing DNAM-1, TIGIT and CD96, and the arcs indicate which receptors are expressed by the corresponding pies. Statistical differences were analyzed using the built-in statistical tool. *p < .05; n = 10 for HD and n=9 for OC patients.
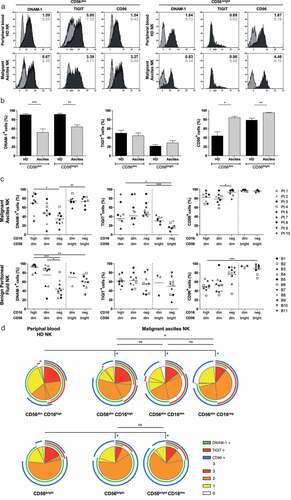
Figure 2. DNAM-1, TIGIT and CD96 are dose-dependently upregulated by rhIL-15 and DNAM-1 is downregulated by OC tumor cells. (a) DNAM-1 (n = 8), TIGIT (n = 6) and CD96 (n = 5) expression on NK cells of healthy donors co-cultured with SKOV-3, IGROV-1 or OVCAR-3 spheroids and increasing rhIL-15 concentrations for 7 days. Data is shown as mean+SEM. One-Way ANOVA with Bonferroni correction was used for statistical analysis, * p < .05, ** p < .01 and *** p < .001. (b) DNAM-1, TIGIT and CD96 expression on healthy donor NK cells co-cultured with a patient-derived primary tumor cell line and increasing rhIL-15 concentrations for 7 days cultured in duplicate. (c) DNAM-1, TIGIT and CD96 expression on healthy donor NK cells co-cultured with patient-derived tumor cells and increasing rhIL-15 concentrations for 7 days cultured in duplicate
Figure 3. SKOV-3 tumor-bearing mice have significantly reduced DNAM-1 expression in CD56dim and CD56bright NK cells. (a) Schematic overview of the mouse experiment. (b) Bioluminescence imaging (BLI) signal of the SKOV-3 tumor-bearing mice over time (n = 5). (c) Expression of DNAM-1, TIGIT and CD96 on CD56dim (left) and CD56bright (right) NK cells by flow cytometric measurement on day 0. The top graphs depict percentage positive cells and the bottom graphs depict ΔMFI. (d) Expression of DNAM-1, TIGIT and CD96 on intraperitoneal NK cells harvested 14 days after adoptive transfer in SKOV-3 tumor-bearing NSG mice and control mice. Day 0 data is represented by dotted lines as a reference. The top graphs depict percentage positive cells and the bottom graphs depict ΔMFI. Cumulative data are shown (lines indicate mean, n = 5 per group). A One-Way ANOVA with Bonferroni correction was used for statistical analysis, * p < .05 and *** p < .001. (e) Representative plots are shown of CD107a and IFNγ expression by CD56dim NK cells after 4 h co-culture with SKOV-3 target cells, low dose rhIL-15 and TIGIT blockade or matching isotype control. (f) The percentage of CD107a and IFNγ expressing CD56dim NK cells are shown on day 0 and day 14. Day 14 results are pooled NK cells from 5 different mice from either tumor-bearing or control mice
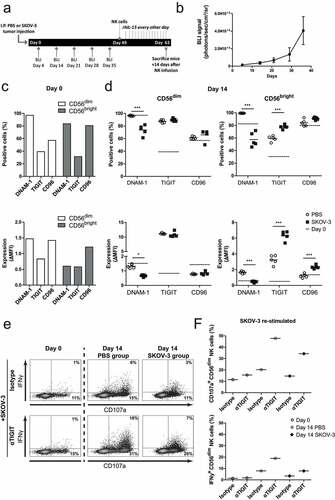
Figure 4. CD56dim NK cell degranulation toward OC cell lines is boosted by TIGIT blockade and inhibited by DNAM-1 blockade. (a) Healthy donor CD56dim NK cells fold change for CD107a and IFNγ after 4 h stimulation with SKOV-3 target cells, low dose rhIL-15, and TIGIT, DNAM-1 and/or CD96 blockade or matching isotype controls. Fold change in CD107a and IFNγ expression on CD56dim cells following antibody treatment is calculated relatively to the condition with low dose rhIL-15 and 4 h SKOV-3 stimulation only. Cumulative data are shown as mean+SEM (n = 6) (b) IGROV-1 and OVCAR-3 stimulation for 4 h in the presence of TIGIT and/or DNAM-1 blockade or matching isotype controls. Fold change in CD107a and IFNγ expression on CD56dim cells following antibody treatment is calculated relatively to the condition with low dose rhIL-15 and 4 h IGROV-1 or OVCAR-3 stimulation only −3 (n = 6 for IGROV-1 and n = 6 for OVCAR). A One-Way repeated measure ANOVA with Bonferroni correction was used for statistical analysis, * p < .05, ** p < .01 and *** p < .001
Table 2. Ovarian cancer (primary) cell line characteristics
Figure 5. TIGIT blockade boosts functional responsiveness of CD56dim NK cells of OC patients with a baseline reactivity against SKOV-3 cells. (a) Schematic overview of the mouse experiment. (b) Bioluminescence imaging (BLI) signal of SKOV-3 tumor-bearing mice over time in “control”, “NK” only and “NK+TIGIT” blockade groups (n = 15 per group). (c) Total number of peritoneal NK cells harvested from “NK” only and “NK+TIGIT” blockade groups as measured by flow cytometry (average of bead and volume count cytoflex). (d) Percent CD107a (top graph) and IFNγ (bottom graph) from peritoneal NK cells harvested from “NK” only and “NK+TIGIT” groups which were re-stimulated ex-vivo with SKOV-3 for 4 h in the presence of low dose rhIL-15. (e) Percent CD107a (top graph) and IFNγ (bottom graph) from peritoneal NK cells harvested from “NK” only group re-stimulated with SKOV-3 in the presence of low dose rhIL-15 in combination with TIGIT, DNAM-1, TIGIT/DNAM-1 co-blockade or corresponding isotype control(s). (f-g) Percentage CD107a+ and IFNγ+ CD56dim NK cells upon overnight treatment with low dose rhIL-15 (1 nM) and subsequent 4 h stimulation with K562 (f) or SKOV-3 (g). Based on a cutoff of 10% CD107a expression on CD56dim NK cells co-cultured with SKOV-3 and rhIL-15 (without additional treatment) patients were subdivided in responder (≥10%) and non-responder (<10%) cohorts. Cumulative data of healthy donors (HD; n = 10) and ovarian cancer patients (Pt; n = 9) are shown with median. The Mann-Whitney test was used for statistical analysis, * p < .05. (h) CD56dim NK cells positive for CD107a and IFNγ after 4 h stimulation with SKOV-3 target cells, low dose rhIL-15 (1 nM), and TIGIT and/or DNAM-1 blockade or matching isotype controls. Cumulative data shown for SKOV-3 responders only (lines indicate mean, n = 6). A One-Way ANOVA with Bonferroni correction was used for statistical analysis, * p < .05 and *** p < .001