
Figures & data
Figure 1. CD103+CD4+ T cells accumulate in gastric cancer and associates tumor progression. (a) Representative immunofluorescence staining with CD4(green), CD103 (red) and DAPI (blue) in gastric cancer tissues. (b) Representative dual immunohistochemical staining images(left) for CD4(blue) and CD103(brown) and quantitative analysis(right) of CD103+CD4+ T cells in intratumoral tissues (n = 469) and corresponding peritumoral tissues (n = 469). Significance was assessed by unpaired t test. (c) Representative flow cytometry (FCM) analysis images (left) and quantification (right) of CD103+CD4+ T cells in CD3+ cells in intratumoral tissues and corresponding peritumoral tissues of gastric cancer fresh samples (n = 14). Significance was assessed by Wilcoxon matched-pairs signed-ranks test. (d) Relationship between intratumoral CD103+CD4+ T cells infiltration and TNM stage was examined based on IHC staining. Significance was assessed by unpaired t test. Bar plots show mean ± SD
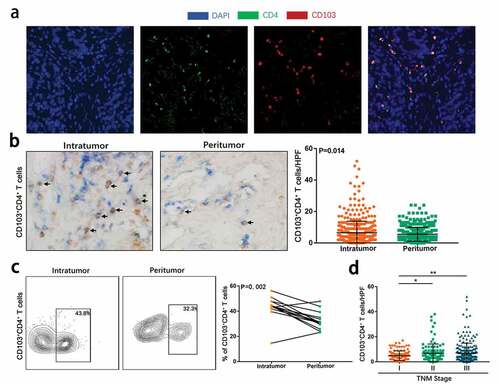
Figure 2. Intratumoral CD103+CD4+ T cells predict poor prognosis in gastric cancer patients. (a and b) Kaplan–Meier survival curves for overall survival of gastric cancer patients in Discovery cohort(a) and Validation cohort(b) on the basis of intratumoral CD103+CD4+ T cell infiltration. (c and d) Kaplan–Meier survival curves for overall survival of gastric cancer patients in Discovery cohort(c) and Validation cohort(d) on the basis of intratumoral total CD4+ T cell infiltration. (e and f) Kaplan-Meier survival curves for overall survival of gastric cancer patients in the Discovery cohort (e) and Validation cohort (f) further stratified on the basis of CD103+CD4+ T cells in the total CD4+ T cell strata
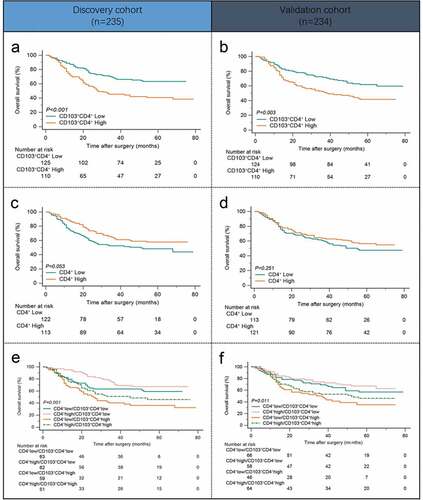
Figure 3. Intratumoral CD103+CD4+ T cells indicate inferior responsiveness to fluorouracil-based adjuvant chemotherapy in stage II/III patients. (a andb) Kaplan-Meier survival curves for overall survival of gastric cancer patients with low CD103+CD4+ T cell infiltration in Discovery cohort (a) and Validation cohort (b) on the basis of ACT therapy. (c and d) Kaplan-Meier survival curves for overall survival of gastric cancer patients with high CD103+CD4+ T cell infiltration in Discovery cohort (c) and Validation cohort (d) on the basis of ACT therapy
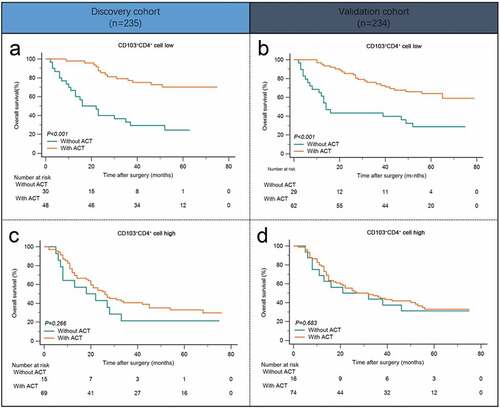
Figure 4. Intratumoral CD103+CD4+ T cells express high level of IL-10 and display features of tissue residency. (a) Flow cytometry analysis of Th1 type cytokines (IFN-γ, TNF-α) in CD103−CD4+ and CD103+CD4+ T cells from gastric cancer tissues (n = 17,24). (b) Flow cytometry analysis of Th2 type cytokine IL-13 in CD103−CD4+ and CD103+CD4+ T cells from gastric cancer tissues (n = 24). (c) Flow cytometry analysis of Th17 type cytokine IL-17A in CD103−CD4+ and CD103+CD4+ T cells from gastric cancer tissues (n = 24). (d) Flow cytometry analysis of Treg type cytokines (IL-10, TGF-β1) in CD103−CD4+ and CD103+CD4+ T cells from gastric cancer tissues (n = 24). (e) Flow cytometry analysis of tissue egression markers (CCR7 and CD62L) and transcriptional factors (Blimp-1, Hobit, Runx-3 and TCF-1) in CD103−CD4+ and CD103+CD4+ T cells from gastric cancer tissues(n = 16,16,16,16,16,5). Significance was assessed by paired t test
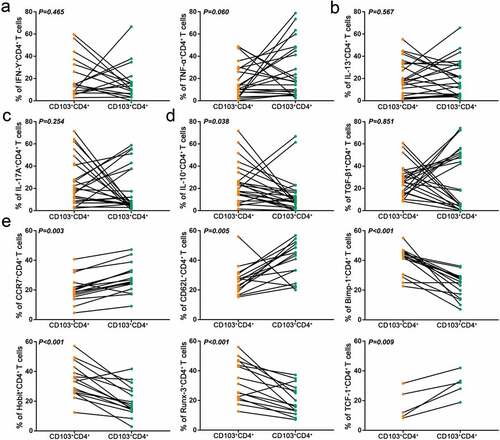
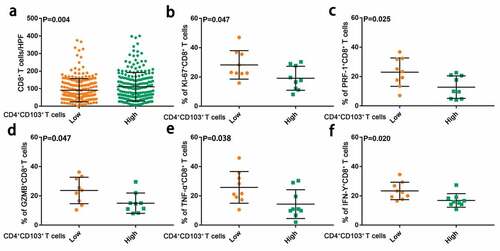
Figure 5. Intratumoral CD103+CD4+ T cells are associated with impaired anti-tumor immunity by CD8+ T cells. (a) Numbers of CD8+ T cells in tissue microarray samples from patients with low and high CD103+CD4+ T cell infiltration. Significance was assessed by unpaired t test. (b) Ki67 expression of CD8+ T cells in gastric cancer tissue samples from patients with low(n = 9) and high(n = 9) CD103+CD4+ T cell infiltration. Significance was assessed by unpaired t test. (c and d) Cytolytic markers expression (PRF-1 and GZMB) of CD8+ T cells in gastric cancer tissue samples from patients with low(n = 9) and high(n = 9) CD103+CD4+ T cell infiltration. Significance was assessed by unpaired t test(c) and Mann Whitney U test(d). (e and f) Effector cytokines expression (TNF-α and IFN-γ) of CD8+ T cells in gastric cancer tissue samples from patients with low(n = 9) and high(n = 9) CD103+CD4+ T cell infiltration. Significance was assessed by Mann Whitney U test(e) and unpaired t test(f). Bar plots show mean ± SD
Availability of data and materials
All data generated that are relevant to the results presented in this article are included in this article. Other data that were not relevant for the results presented here are available from the corresponding author Prof. Zhang upon reasonable request.