
Figures & data
Table 1. Results about prognostic value of PD-L1 expression in HNSCC pre-clinical studies
Table 2. Results about prognostic value of PD-L1 expression in HNSCC clinical trials
Table 3. Studies comparing different PD-L1 IHC assays
Figure 1. PD-L1 staining (E1L3N, Cell signaling technology) in head and neck carcinoma sample shows a weak staining of the tumor component (t) contrasting with a strong staining of the immune component (i) located in the stroma. Pathologists have scored this case 15% by tumor proportion score (TPS) and 40 by combined positive score (CPS)
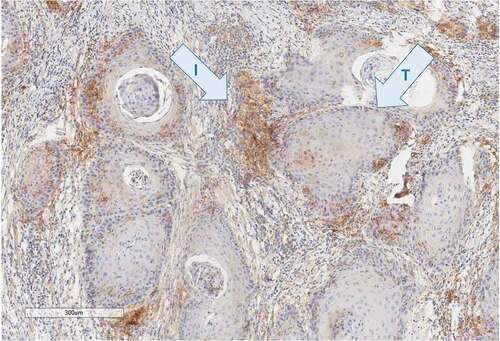
Table 4. Response to the PD-1/PD-L1 inhibitors according to PD-L1 expression in HNSCC clinical trials