
Figures & data
Table 1. Associations between tPDPNs and clinicopathological characteristics in gastric cancer patients
Figure 1. Accumulated tPDPNs in gastric cancer are correlated with tumor progression. (a) Representative immunohistochemistry (IHC) images of tumor-infiltrating PDPN+ cells (tPDPNs) and peritumor-infiltrating PDPN+ cells (ptPDPNs) in gastric tissues. Arrow heads show tPDPNs and ptPDPNs. Scale bars, 100 μm. (b) IHC evaluation of tPDPNs versus ptPDPNs. Paired t test. (c) Distribution of tPDPNs across tumor-node-metastasis (TNM) stage. One-way ANOVA followed by Tukey’s multiple comparisons. (d) Distribution of PDPN mRNA level across TNM stage. One-way ANOVA followed by Tukey’s multiple comparisons. ns refers to not significant
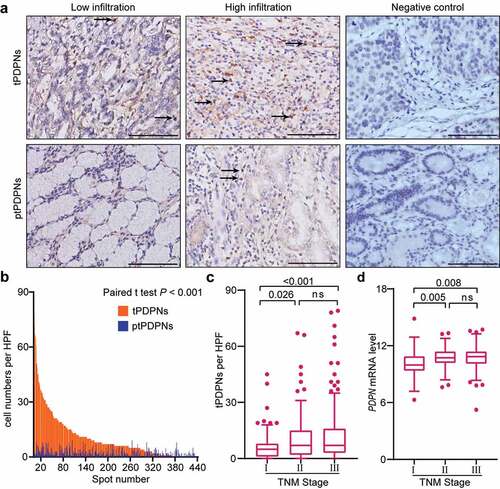
Figure 2. tPDPNs predict poor prognosis in gastric cancer. (a-b) Kaplan-Meier curves for overall survival (OS) and disease-free survival (DFS) in gastric cancer patients according to tPDPNs status in Discovery set and Validation set. The OS (a) and DFS (b) were compared between tPDPNs low and high subgroups. Log-rank test was performed for Kaplan-Meier curves. (c) Multivariate analysis of OS and DFS were conducted on the basis of clinicopathological characteristics in Discovery set and Validation set. HR, hazard ratio; CI, confidence interval
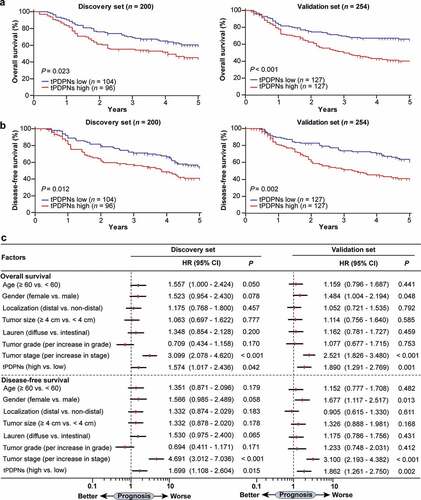
Figure 3. tPDPNs are associated with inferior therapeutic responsiveness to fluorouracil. (a) The overall survival (OS) curves and disease-free survival (DFS) curves in stage II and III gastric cancer patients according to adjuvant chemotherapy (ACT) application. (b) The OS curves and DFS curves in tPDPNs low subgroup according to ACT application. (c) The OS curves and DFS curves in tPDPNs high subgroup according to ACT application. Log-rank test was performed for Kaplan-Meier curves. (d) A test for an interaction between tPDPNs and responsiveness to ACT. HR, hazard ratio; CI, confidence interval
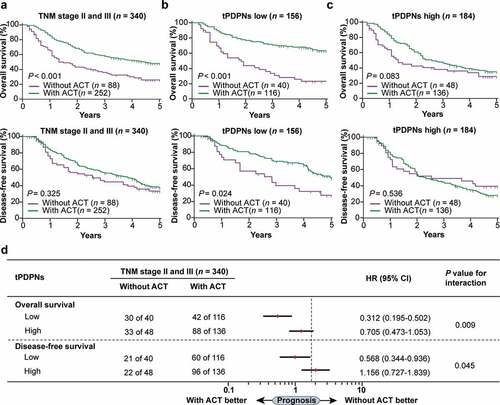
Table 2. tPDPNs are associated with PD-1+ cells and TIM-3+ cells
Figure 4. tPDPNs are associated with an exhausted CD8+ T-cell phenotype in gastric cancer. (a) Immunohistochemistry analysis of the immune contexture in tPDPNs low and high subgroups. Treg, regulatory T; NK, natural killer; Mac, macrophages; Neu, neutrophils; DCs, dendritic cells. (b) Relationship between PDPN mRNA level and exhausted CD8+ T cell gene signature in TCGA database. (c-e) Flow cytometry to detect the number of CD8+ T cells in CD45+ cells (c), the expression of effector molecules (interferon-γ, granzyme B and perforin-1) in CD8+ T cells (d) and immune checkpoints (PD-1, TIM-3, CTLA-4 and LAG-3) in CD8+ T cells (e) between tPDPNs low and high subgroups. Unpaired t test. ns refers to not significant. PD-1, programmed death-1; TIM-3, T-cell immunoglobulin and mucin-domain containing-3; CTLA-4, cytotoxic T-lymphocyte-associated protein-4; LAG-3, lymphocyte-activation gene-3. (f-g) The overall survival (OS) curves (f) and disease-free survival (DFS) curves (g) in all gastric cancer patients, tPDPNs low subgroup and tPDPNs high subgroup according to CD8+ T cell status. Log-rank test was performed for Kaplan-Meier curves
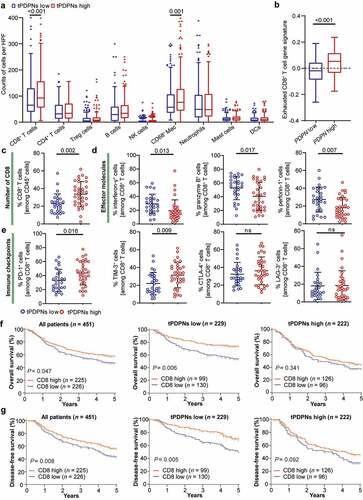
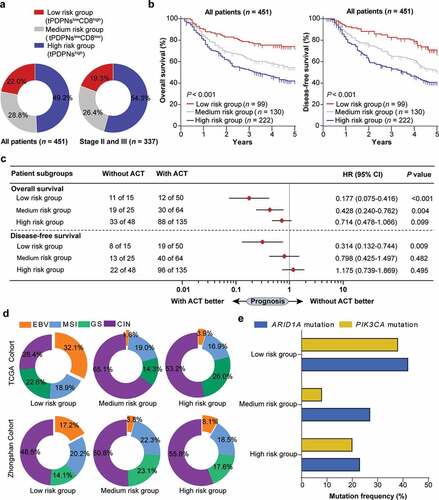
Figure 5. Stratification based on tPDPNs and CD8+ T cells are associated with prognosis, therapeutic responsiveness to ACT and molecular classification. (a) Pie charts show the proportion of three stratified risk groups in all or stage II and III gastric cancer patients. (b) The overall survival (OS) curves and disease-free survival (DFS) curves for three stratified risk groups. Log-rank test was performed for Kaplan-Meier curves. (c) Cox regression analysis for the difference of responsiveness to adjuvant chemotherapy (ACT) in three risk groups. HR, hazard ratio; CI, confidence interval. (d) Pie charts show the proportion of molecular subtypes including EBV, MSI, GS and CIN in three stratified risk groups in TCGA cohort (up) and Zhongshan cohort (down). EBV, Epstein–Barr virus; MSI, microsatellite instability; GS, genomically stable; CIN, chromosomal instability. (e) ARID1A and PIK3CA gene mutation frequency in three stratified risk groups
Supplemental Material
Download ()Data availability
All data generated that are relevant to the results presented in this article are included in this article.