
Figures & data
Figure 1. Patients with PDAC have normal numbers of NK cells within blood but expression of CD16 is increased on the CD56dim subset
Figure 2. Peripheral NK cells from PDAC patients express reduced levels of the activating receptors NKG2D and NKp30
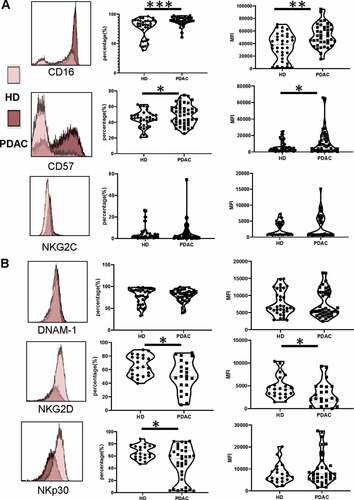
Figure 3. NK cells within the blood of PDAC patients have reduced cytotoxic function and express high levels of IL-10
Figure 4. NK cells are a minority population within PDAC tumors and show strong downregulation of CD16
Figure 5. Expression of activatory receptors is reduced substantially on NK cells within the PDAC tumor
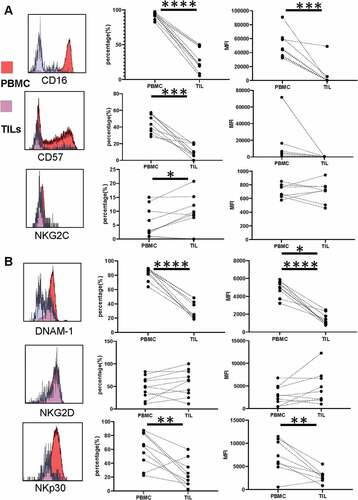
Figure 6. The PDAC tumor microenvironment expresses high levels of NK cell ligands and tumors induce downregulation of CD16 and CD57 on NK cells
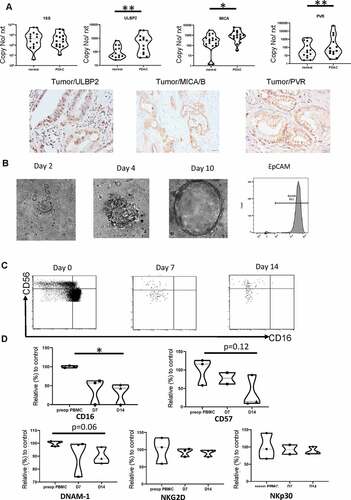
Figure 7. The CD56dim CD16neg NK population within blood does not affect overall survival but is positively correlated with tumor recurrence
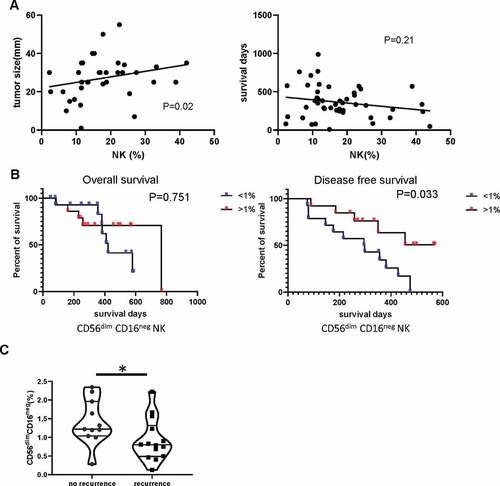
Table 1. Demographic, diagnostic and therapeutic characteristics of two groups of PDAC patients with defined on the basis of CD56dim CD16neg NK cell population (<1% and ≥ 1%)
Table 2. Clinical survival of two groups of PDAC patients with defined on the basis of CD56dim CD16neg NK cell population (<1% and ≥ 1%)
Supplemental Material
Download ()Availability of data and material
All data supporting the conclusion of this study have been included within the article. They can be requested through corresponding authors.