Figures & data
Figure 1. High MIF expression correlates with poor overall survival in melanoma patient cohorts (a) Kaplan-Meier analysis performed in public TCGA database (http://gepia2.cancer-pku.cn/#index) correlating the high MIF expression levels with poor overall survival in SKCM patients (n = 230). (b) Comparison of MIF expression levels in normal versus SKCM patients sorted from public GDC TARGET GTEX cohort (Xena Browser, University of California) (n = 1025). (c) High MIF expression correlates with clinical progressive disease based on data from GDC TCGA SKCM assessed from GDC TCGA melanoma cohort (Xena Browser, University of California) (n = 477). (d) Overall survival by Kaplan-Meier analysis sorted in GDC TCGA SKCM metastatic cohort (Xena Browser, University of California) (n = 352). (e) Kaplan-Meier analysis assessed from TIDE (Tumor Immune Dysfunction and Exclusion) database correlating the MIF high expression levels with poor Overall Survival (OS) in SKCM patients cohort receiving anti-CTLA-4 therapy (red curve) (n = 26). (f) Inverse correlation between high MIF expression and Progression Free Survival in SKCM patient cohort treated with anti-PD-1 antibody therapy (n = 37). ANOVA t-test was used for statistical analysis. *P < .05, **P < .01, and ****P < .0001
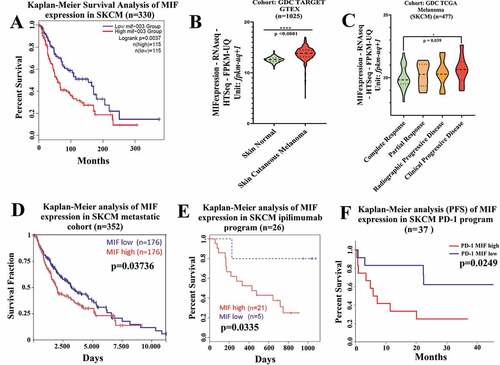
Figure 2. MIF/CD74 axis inhibition enhances immune-checkpoint blockade therapy efficacy. (a) Experimental design using subcutaneous models. Mice were injected on the right flank with 1 × 10⁵ TMT (sensitive anti-CTLA-4 antibody) or 3I-F4 (resistant anti-CTLA-4 antibody) and followed up for 16 days. Green arrows represent anti-CTLA-4 or anti-PD-L1 injections, while blue arrows indicating 4-IPP injections. (b) Treatment with anti-CTLA-4 alone significantly decreased tumor growth in TMT S.C. model (p < .0001). The combination of anti-CTLA-4 with 4-IPP treatment proved to be significantly more effective than treatment with anti-CTLA-4 alone (p < .01); (c) anti-CTLA-4 alone had no effect in the resistant 3I-F4 tumor cells, however, when combined with 4-IPP, a decrease in tumor growth was observed (p < .001); (d, e) Treatment with anti-PD-L1 alone or in combination with 4-IPP significantly inhibited tumor growth in both TMT or 3I-F4 tumor cells. No advantage was observed in the combination treatment; (f) Experimental design using intravenous (i.v.) model. Mice were injected in the tail vein with 106 TMT or 3I-F4 and followed up for 14 days. Green arrows represent anti-CTLA-4 or anti-PD-L1 treatment, while blue arrows represent 4-IPP treatment. (g) Effect of anti-CTLA-4 alone or in combination with 4-IPP on TMT tumor cells significantly reduced the lung nodules number as compared with the vehicle (corn oil) plus IgG2 control. The combination treatment was significantly more effective than treatment with anti-CTLA-4 alone (p < .01). The anti-PD-L1 treatment alone or in combination with 4-IPP showed no effect in TMT I.V. model. (h) Treatment with anti-CTLA-4 alone had no effect on 3I-F4 lung colonies number, however, when combined with 4-IPP, a significant decrease in the lung colonies number was observed (p < .01). The anti-PD-L1 alone or combined with 4-IPP had no effect in 3I-F4 I.V. model. Data are cumulative of one experiment with five mice per group. Error bars represent the mean ± SEM. *P < .05, **P < .01, and ****P < .0001 using t-Test statistical analysis
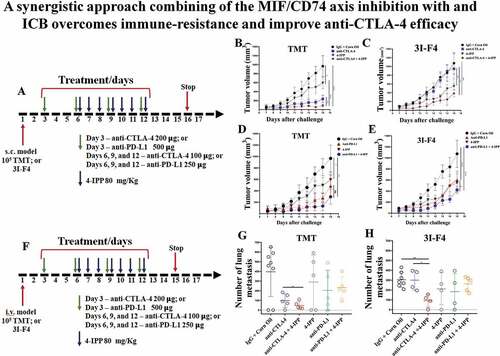
Figure 3. High MIF expression levels correlate with immunosuppressive networks in melanoma patients. (a) The RNA-seq MIF expression data from GDC TCGA melanoma patients who received anti-CTLA-4 therapy (https://xenabrowser.net/) (n = 26).Volcano plot depicting the most significant upregulated and downregulated immune genes, with high MIF expression levels. Several genes with immunosuppressive functions were identified. (b) MIF-suppressed immune networks in CTLA-4-resistant metastatic melanoma. Red dots represent immune suppression categories while green and blue dots represent immune activation categories and general immune categories respectively. Red thick, green thick and blue thick lines indicate immune suppression categories, immune activation categories and general immune categories, respectively. (c) Kaplan-Meier analysis correlating the T-cell dysfunctions with MIF expression levels in melanoma patients treated with anti-CTLA-4 therapy sorted from public TCGA TIDE (Tumor Immune Dysfunction and Exclusion) database (MIF high n = 10; MIF low n = 307). (d) Spearman´s correlation analysis between MIF expression levels and Treg markers (FOXP3 and IL2RA) were sorted from the TIMER (Tumor IMmune Estimation Resource) database using metastatic melanoma patient cohort (N = 368). MIF expression levels showed a significantly positive correlation with FOXP3 and IL2RA expression levels
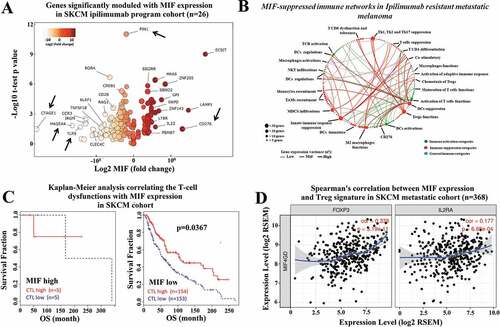
Figure 4. Immune-checkpoint blockade therapy, combined with 4-IPP, enhance M1-like macrophage and triggers antitumor effect. Subcutaneous tumors from TMT or 3I-F4 tumor cells were stained using anti-F4/80 and anti-iNOS as markers for the M1-like macrophage population while anti-F4/80, and anti-Arg.1 were used to identify the M2-like macrophage population. (a) Quantification of M1-like macrophages infiltration after treatment with anti-CTLA-4 alone or in combination with 4-IPP showed an increase in M1-like MO in TMT tumors; (b) Quantification analysis of anti-CTLA-4 alone had no effect on 3I-F4 tumors, whereas when combined with 4-IPP it induced an increase in M1-like macrophage infiltration in the TME. (c) Quantification of M2-like macrophages after anti-CTLA-4 therapy alone or combined with 4-IPP showed a decrease in M2-like macrophages in the TMT tumors. (d) Quantification of M2-like macrophages after treatment with anti-CTLA-4 alone showed no effect in 3I-F4 tumor cells, whereas the combination with 4-IPP significantly reduced the M2-like macrophage phenotype; (e, f) Quantification of M1-like macrophages after treatment with anti-PD-L1 therapy alone or combined with 4-IPP significantly increased the M1-like macrophage infiltration in both models (TMT) and (3I-F4) tumors. (g, h) Quantification of M2-like macrophage phenotype after treatment with anti-PD-L1 therapy alone or combined with 4-IPP showed a significant decrease of M2-like macrophage infiltration in both models (TMT) and (3I-F4) tumors; N = 5 mice per group; at least three fields assessed per sample. Graphs show quantification of positive F4/80+ Arg1+ or F4/80+ Arg.1 +. Error bars represent the mean ± SEM. *P < .05, **P < .01, and ***P < .001 using a two-tailed unpaired t-test
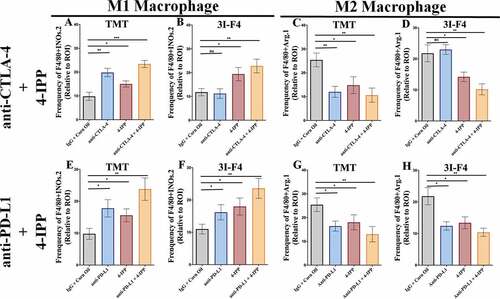
Figure 5. Immune-checkpoints blockade combined with MIF/CD74 axis inhibition enhance T-cell infiltration. TMT or 3I-F4 tumors were stained with anti-CD3+, anti-CD4+, anti-CD8+ cells and anti-Granzyme b. All quantifications were performed in mice treated with anti-CTLA-4 or anti-PD-L1 antibodies alone or in combination with 4-IPP. (a) Quantification of CD3 T-cells infiltration in TMT tumors; (b) Quantification of CD4 T-cells infiltration in TMT tumors; (c) Quantification of CD8 T-cells infiltration in TMT tumors; (d) Quantification of Granzyme b secretion in TMT tumor microenvironment. All quantifications showed that immune-checkpoint blockade antibodies alone or combined with 4-IPP induced an increase in T-cell infiltration in TMT tumor microenvironment. (e) Quantification of CD3 T-cells infiltration on 3I-F4 tumors; (f) Quantification of CD4 T-cells infiltration in 3I-F4 tumors; (g) Quantification of CD8 T-cells infiltration in 3I-F4 tumors; (h) Quantification of Granzyme b secretion in 3I-F4 tumor. All quantifications showed that anti-CTLA-4 alone did not induce T-cell infiltration, but when combined with 4-IPP a significant increased of T-cell infiltration in 3I-F4 tumors was observed. The anti-PD-L1 antibody alone or combined with 4-PP, significantly increased T-cell infiltration in 3I-F4 tumors; N = 5 mice per group; at least three fields assessed per sample. Graphs show quantification of positive CD3+, or CD4+, CD8+ T cells or gramzyme b. Error bars represent the mean ± SEM. *P < .05, **P < .01, and ***P < .001 using a two-tailed unpaired t-test
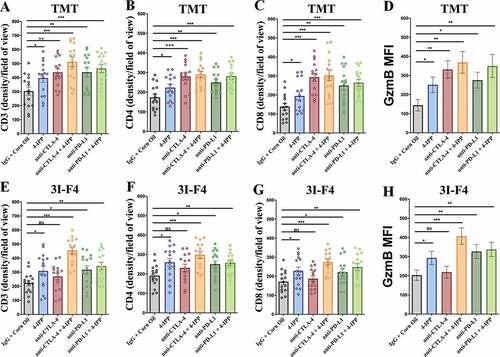
Figure 6. MIF/CD74 axis inhibition down-regulates lactate production levels in vitro and in vivo. (a) Secretion of MIF under normoxia condition in the TMT and 3I-F4 tumor cell cultures incubated for 24 h, in ELISA kit. (b) Quantification of lactate concentration in media under normoxia condition from TMT and 3I-F4 tumor cells cultured for 24 hours using ELISA kit. (c) Quantification of lactate concentration in media under hypoxia condition in TMT and 3I-F4 tumor cells cultured for 24 hours using ELISA kit. (d) Quantification of lactate concentration in media under hypoxia condition in TMT cells treated with 100 µM of 4-IPP and incubated for 24 h, inELISA kit. (e) Quantification of lactate concentration in media under hypoxia condition in 3I-F4 cells treated with 100 µM of 4-IPP and incubated for 24 hours. (f) Western blotting analysis of HIF-1α expression in TMT or 3I-F4 cell lines after treatment with 100 µM of 4-IPP for 24 h under hypoxia condition. (g) PD-L1 expression analysis by Western blotting analysis in TMT or 3I-F4 cell lines after treatment with 100 µM of 4-IPP for 24 hours under hypoxia condition. All in vitro data represent three biologically independent experiments. (h) The Immunofluorescence (IF) staining was examined from the subcutaneous model using TMT tumor cells. Tissue samples were stained using anti-LDHA. Quantifications were performed in mice treated with anti-CTLA-4 or anti-PD-L1 alone or in combination with 4-IPP. (i) Quantification of LDHA expression was performed in the subcutaneous model using the 3I-F4 tumors; N = 5 mice per group; at least three fields were examined per sample. Graphs show quantification of positive LDHA expression. Error bars represent the mean ± SEM. *P < .05, **P < .01, and ***P < .001 using a two-tailed unpaired t-test
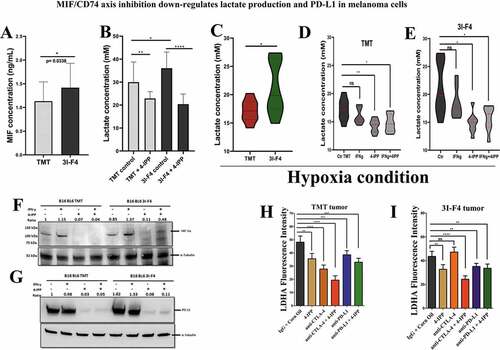
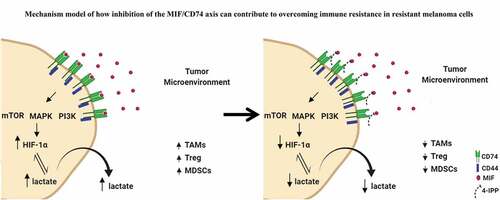
Figure 7. Mechanistic model of how inhibition of the MIF-CD74 axis overcomes resistance of melanoma cells to immune checkpoint blockade. Inhibition of MIF signaling reduces HIF-1α expression levels in resistant cell line (3I-F4) causing reprogramming of the glycolytic pathway by reducing lactate production influencing the TME structure to increase the efficacy of ICB