Figures & data
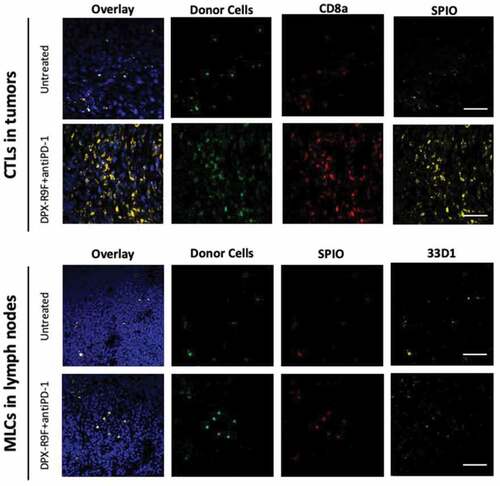
Figure 1. Treatment with DPX significantly reduces tumor burden. a) Caliper measurements of tumor volumes throughout the study. b) Tumor volumes as measured by MRI at days 21 and 28. c) & d) Tumor draining lymph node (left LN) and DPX draining lymph node (right LN) volumes as measured by MRI at day 21 and 28. * indicates significance according to t-test with Dunnett’s multiple comparison correction. ** is p < .05, *** is p < .01, **** is p < .005
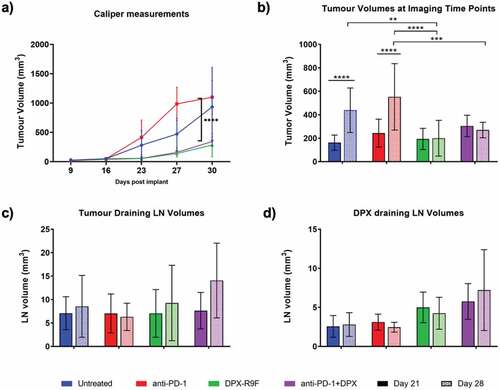
Figure 2. TurboSPI R2* mapping of SPIO-labeled immune cells. a) Representative MRI signal readout demonstrating decay from SPIO-labeled cell. Dotted lines indicate region used for calculation of R2* decay. b) Calibration curves calculated for R2* values of SPIO-labeled cells in vitro (including both CD8 T cells and MLCs). Pixel-wise R2* values are calculated (from a) to yield R2* maps which are overlaid on an anatomical image (in c). The calibration curve (in b) is used to convert these values to cellular density in cells/mm3. Red circle indicates primary tumor with arrows indicating potential cells and necrotic region
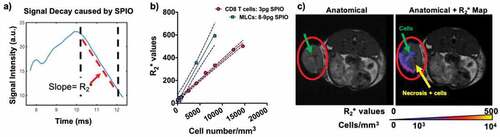
Figure 3. Combination therapy increases recruitment of CTLs between day 21 and day 28. a) Individual graph showing numbers of CTLs recruited to the primary tumor at day 21 compared to the tumor volume at day 21. b) Same as A but for day 28. Both graphs in A and B are statistically non-zero according to linear regression analyses. c) The cellular density of CTLs recruited to the primary tumor for each treatment regime at both day 21 and day 28. d) The difference in cellular density of recruited CTLs between day 28 and day 21. * indicates p < .1 according to t-test with Dunnett’s correction for multiple comparisons. e) Representative maps of cellular recruitment of CTLs for two of the treatment groups. Top row shows cell maps in tumors, bottom row indicates cell maps in lymph nodes. R2* maps were masked to tumors, lymph nodes and surrounding fat pads
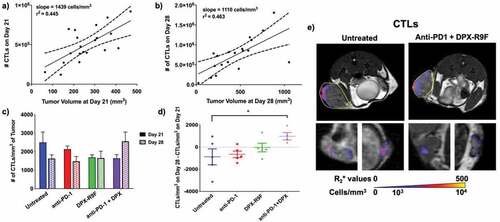
Figure 4. Treatment increases recruitment of MLCs to primary tumor between day 21 and day 28 & untreated mice have higher numbers of MLCs in the tumor at day 21. a) Individual graph showing numbers of MLCs recruited to the primary tumor at day 21 compared to the tumor volume at day 21. b) Same as A but for day 28. Both graphs in A and B are statistically non-zero according to linear regression analyses. c) The cellular density of MLCs recruited to the primary tumor for each treatment regime at both day 21 and day 28. d) The difference in cellular density of recruited MLCs between day 28 and day 21. * indicates p < .1, ** p < .05 according to t-test with Dunnett’s correction for multiple comparisons. E) Representative maps of cellular recruitment of MLCs for two of the treatment groups. Top row shows cell maps in tumors, bottom row indicates cell maps in lymph nodes. R2* maps were masked to tumors, lymph nodes and surrounding fat pads
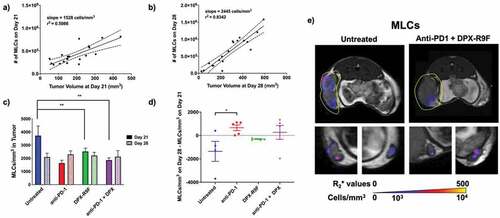
Figure 5. Treatment with DPX increases recruitment of CTLs to tumor-draining lymph node (LLN), increases recruitment of MLCs to treatment draining lymph node (RLN), and the number of MLCs recruited to the LLN increases with time with treatment. The number of CTLs recruited to a) the right lymph node (tumor-draining) or b) the left lymph node (DPX-draining) at days 21 and day 28 for each treatment. The number of MLCs recruited to c) the right lymph node (tumor-draining) or d) the left lymph node (DPX-draining) at days 21 and day 28 for each treatment.* indicates p < .1 according to t-test with Dunnett’s correction for multiple comparisons; ** indicates that the mixed-model ANOVA found a significant effect due to time with p < .05
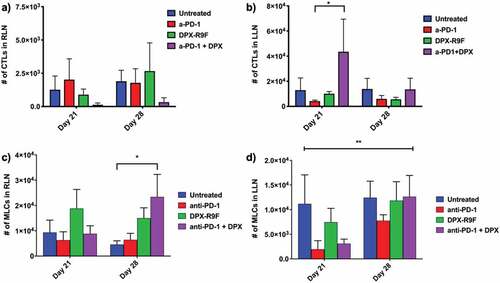
Figure 6. Histological validation of CTL and MLC migration. All tissues shown are from mice who had been either been untreated or treated with both DPX and anti-PD-1. Tumor (top panels) and lymph nodes (bottom panels) from recipient mice were frozen and sectioned for immunohistological staining with either CD8a+ PE (top panels) or stained with the dendritic cell marker 33D1 (bottom panels) followed by Alexa Fluor 633 secondary. Only injected cells isolated from B6-GFP+ mice were GFP+ and Rhodamine B+ for SPIO. Nuclei are stained with DAPI to show tissue morphology. The scale bar represents 50 µm