Figures & data
Figure 1. Results of sPLS-DA in individual omics datasets from TCGA PRAD. To identify immune-related features associated with BCR, prediction modeling was performed using sPLS-DA. Overall, 51 mRNA, 44, miRNA, 36 methylation loci, 32 CNA and 6 SNV were identified. The selected mRNA, miRNA and methylation loci predicted well BCR with BER of 0.20, 0.23 and 0.26, respectively. With BER of 0.46 and 0.51, the selected CNA and SNV, respectively, did not predict well BCR
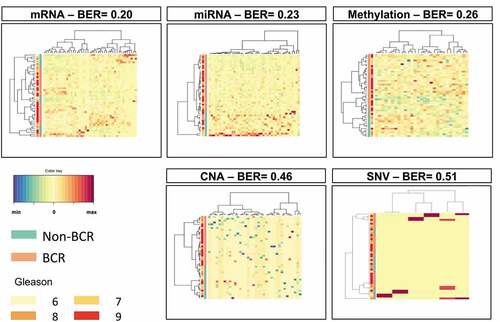
Figure 2. Results of sPLS-DA of the combined omics datasets from TCGA PRAD. Following the sPLS-DA of individual omics datasets, we merged those features into one single set of data and performed a general sPLS-DA analysis. This resulted in an almost perfect prediction of BCR with a BER of 0.05
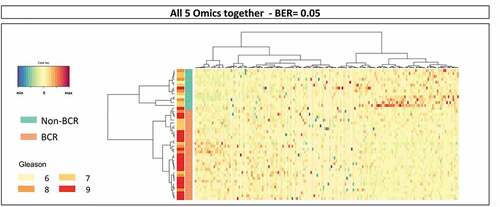
Figure 3. Results of sPLS-DA of LILR gene-related features in the combined omics dataset of TCGA PRAD. The analysis of the 30 LILR gene-related features in the combined dataset resulted in the prediction of BCR with a BER of 0.34
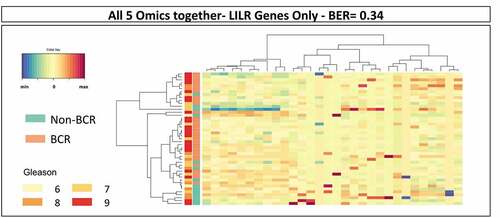
Figure 4. Results of the MINT analysis. Using the combined TCGA-GSE54460-VPCC RNA-seq dataset, five LILR genes were found to be associated together with BCR. The five LILR genes were associated with BCR with a BER of 0.34
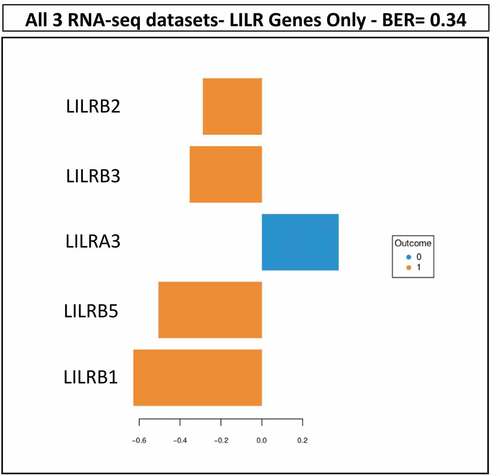
Figure 5. Kaplan-Meier analysis of dichotomized LILRB1 (a), LILRB2 (b), LILRB3 (c), LILRB5 (d) and LILRA3 (f) mRNA levels in the combined TCGA-GSE54460-VPCC RNA-seq dataset. High levels of LILRB mRNA have a tendency to be associated with shorter BCR-free survival but only LILRB1 and LILRB2 can predict BCR with a significant p value. The sum of the levels of these mRNA (e) was also associated with a significantly shorter BCR-free survival. At the opposite, higher level of LILRA3 mRNA (f) is associated with a higher BCR-free survival
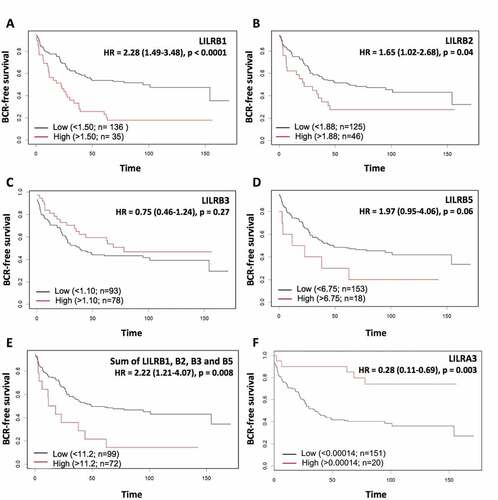
Figure 6. Kaplan-Meier analysis of dichotomized LILRB1 (a), LILRB2 (b), LILRB3 (c), and LILRB5 (d) mRNA levels in the CPC-GENE RNA-seq dataset. High mRNA levels of LILRB2, LILRB3, LILRB5 genes, but not that of LILRB1, were significantly associated with shorter BCR-free survival. The sum of these mRNA levels (e) was also associated with a significantly shorter BCR-free survival (HR = 2.51, p = 0,009). The association of LILRA3 mRNA level with BCR could not be analyzed as there was no LILRA3 mRNA data in the CPC-GENE dataset
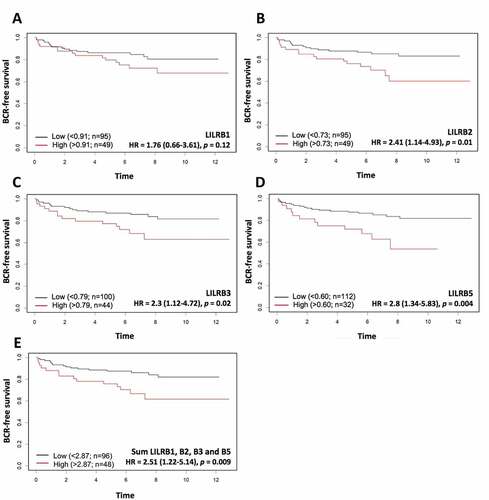
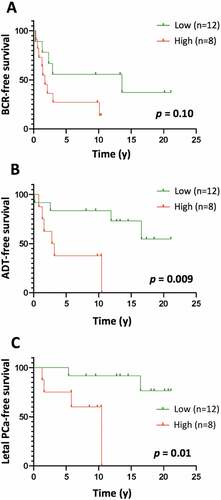
Figure 7. Kaplan-Meier curves of BCR-free (a), ADT-free (b) and lethal PCa-free (c) survival according to high (level 3) vs low (levels 1–2) levels of LILRB1+ cells in the tumor area of high-risk PCa samples. The number of LILRB1+ cells in the tumor area of 20 formalin-fixed and paraffin-embedded T2-T3 stage prostate tumor samples with long clinical follow-up was analyzed using immunohistochemistry. Expression of LILRB1 was classified as level 1, 2 and 3 corresponding to low, intermediate and high number of positive cells. Statistical significance was determined by the log-rank test