Figures & data
Table 1. Patient characteristics
Figure 1. Myeloid cells in peripheral blood differ in uveal melanoma patients and in healthy controls. (a) The percentages of cells with a phenotype of M-MDSCs (CD33+CD14+HLA-DR−/low), classical monocytes (CD33+CD14++CD16−), intermediate monocytes (CD33+CD14++CD16+), non-classical monocytes (CD33+CD14+CD16++), CD1c+CD141− DCs (CD33+CD14−CD16−HLA-DR+) and CD1c−CD141+ DCs among all leukocytes in peripheral blood for uveal melanoma patients (Mel) before IHP and for healthy controls (Ctrl). The expression of (b) CD86, (c) HLA-ABC, (d) PD-L1 and (e) HLA-DR on five of the myeloid populations (nMelanoma = 28, nCtrl = 9, Mann-Whitney test). MFI = Median fluorescence intensity
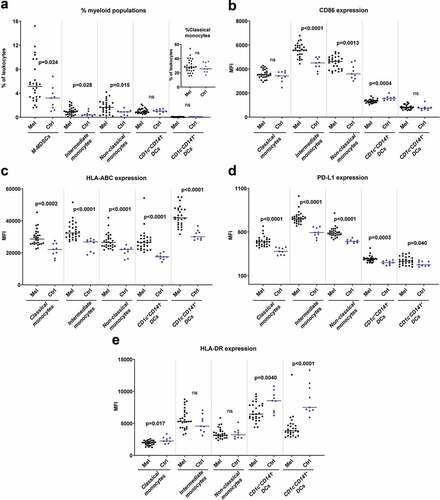
Figure 2. Presence of immunosuppressive T cell populations in peripheral blood of uveal melanoma patients. (a) The percentages of CD4+ and CD8+ T cells (CD3+) among all leukocytes in peripheral blood for uveal melanoma patients (Mel) before IHP and for healthy controls (Ctrl). The expression of (b) HLA-DR, (c) PD-1, (d) CCR4 and (e) CXCR3 on the T cell populations. (f) The percentage of CD4+Foxp3+ T cells among all leukocytes for patients and for controls, and the expression of (g) PD-1 and (h) PD-L1 on these cells (nMelanoma = 28, nCtrl = 9, Mann-Whitney test). The expression of HLA-DR and PD-1 on CD8+ T cells is depicted against the expression level of HLA-ABC on (i) classical monocytes and of (j) CD1c+CD141− DCs, with the lines adapted from linear regression. (k) The expression of HLA-ABC on classical monocytes and on CD1c+CD141− DCs were correlated against the levels of HLA-DR and PD-1 on CD8+ T cells utilizing Spearman correlation (n = 28). MFI = Median fluorescence intensity
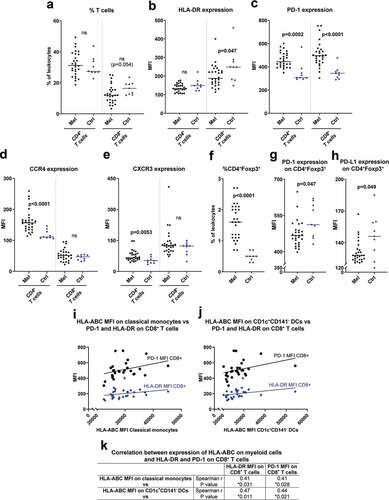
Figure 3. Correlation between activated myeloid cells in peripheral blood and CD8+ T cells in tumor. The number of CD8+ cells in tumor biopsies from uveal melanoma liver metastases are depicted against the expression of HLA-ABC on (a) monocytes and (b) on DCs in peripheral blood. All lines are adapted from linear regression. (c) The amount of CD8+ cells in tumor biopsies were correlated against the HLA-ABC expression on monocytes and on DCs, utilizing Spearman correlations (n = 13). MFI = Median fluorescence intensity
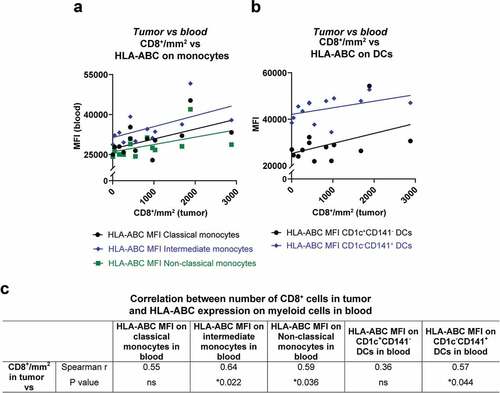
Figure 4. High tumor infiltration of CD8+ and CD68+ cells correspond to longer overall survival. A dichotomization of uveal melanoma patients based on above or below median infiltration of (a) CD8+ cells, (b) PD-1+ cells, (c) CD68+ and (d) CD163+ cells in liver metastases obtained prior to IHP correlated to overall survival (n = 14, log-rank test). Representative immunostainings from the same area in consecutively sectioned slides for (e) CD8, (f) PD-1, (g) CD68 and (h) CD163. Normal liver tissue is shown to the right part of each image
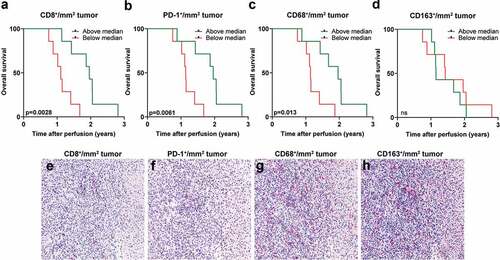
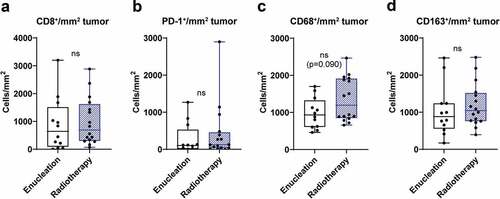
Figure 5. Tumor infiltration of immune cells and treatment of primary tumor. Uveal melanoma patients were dichotomized into two groups, enucleation or radiotherapy, based on treatment of their primary uveal melanoma. The number of tumor infiltrating (a) CD8+ cells, (b) PD-1+ cells, (c) CD68+ and (d) CD163+ cells in liver metastases obtained prior to IHP were thereafter analyzed in each group (n = 28, Mann-Whitney test)