Figures & data
Figure 1. Gas plasma irradiation-generated redox chemistry and metabolic activity in breast cancer cells. (a) scheme of the helium (He) gas plasma irradiation of cells in vitro; (b-e) quantification of hydrogen peroxide (H2O2, b), nitrite (NO2−, c), hypochlorous acid (HOCl, d), and pH (e) in gas plasma-irradiated cell culture medium; (f) representative brightfield and DAPI (terminally dead cells, blue) images of MCF-7 and MDA-MB breast cancer cells; (g) quantitative image analysis of dead cells in MCF-7 cultures; (h) metabolic activity in MCF-7 cells at 24 h and 48 h post gas plasma irradiation measured in the entire well containing the cells; (i) quantitative image analysis of dead cells in MDA-MB cultures; (j) metabolic activity in MDA-MB cells at 24 h and 48 h post gas plasma irradiation measured in the entire well containing the cells. Cell data are from three independent experiments. Data are presented as mean (+SD). Statistical analysis was performed using one-way analysis of variances with p < .05 (*) and p < .001 (***); ns = non-significant; vehicle = helium gas treatment alone (plasma ignition off); scale bar is 100 µm
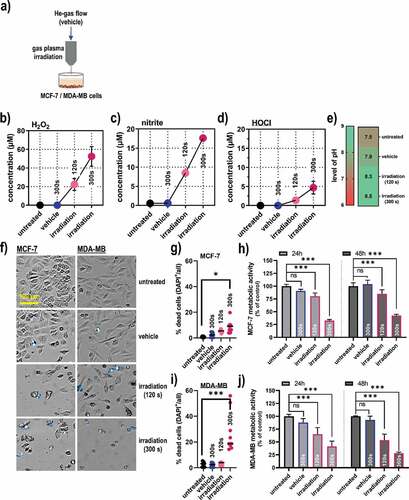
Figure 2. Cell viability and markers of immunogenic cancer cell death in breast cancer cells. (a) representative flow cytometry forward scatter (FSC) and caspase 3/7 dot-plots of MCF-7 cells; (b) quantification of viability data from flow cytometry of MCF-7 cells; (c) representative flow cytometry forward scatter (FSC) and caspase 3/7 dot-plots of MDA-MB cells; (d) quantification of viability data from flow cytometry of MDA-MB cells; (e) overlay histogram from flow cytometry of calreticulin (CRT), heat-shock protein (HSP) 70, HSP 90, major histocompatibility complex (MHC)-I, and programmed death-ligand 1 (PD-L1) in MCF-7 cells; (f-j) quantification of CRT (f), HSP70 (g), HSP90 (h), MHC-I (i), and PD-L1 (j) in viable (caspase 3/7−) MCF-7 cells; (k) overlay histogram from flow cytometry of CRT, HSP70, HSP90, MHC-I, and PD-L1 in MDA-MB cells; (l-p) quantification of CRT (l), HSP70 (m), HSP90 (n), MHC-I (o), and PD-L1 (p) in viable (caspase 3/7−) MDA-MB cells; (q) quantification of LC3 expression 6 h post treatment in MCF-7 and MDA-MB cells; (r-s) early (1 h) and late (48 h) cytokine expression of adenosine triphosphate (ATP), HSP70, interferon (IFN) α2, IFNγ, and interleukin (IL)-6 in MCF-7 (r), and MDA-MB cells (s).Data are representative of at least three independent experiments and presented as mean (min-max boxplot; b,d), individual values (e-j, l-p), mean + SD (q), or mean +SEM (r-s). Statistical analysis was performed using one-way analysis of variances with p < .05 (*) and p < .001 (***)
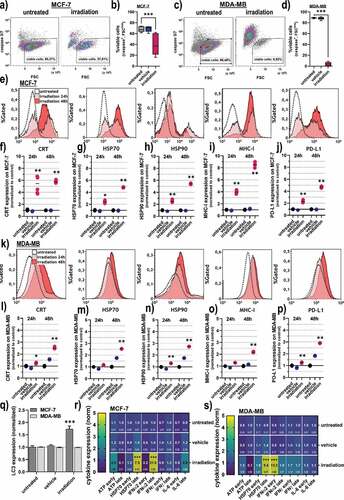
Figure 3. Viability, oxidation, and CRT expression in 3D breast cancer spheroids. (a) representative maximum intensity projection images of MCF-7 and MDA-MB 3D multicellular breast cancer spheroids generated from an overlay digital phase contrast and a sytox green image; (b-d) quantitative image analysis of the dead cell marker sytox green (b), oxidation marker mitotracker red (c), and CRT (d) of the segmented spheroid image area of MCF-7 cells at 24 h and 48 h post gas plasma irradiation exposure; (e-g) quantitative image analysis of sytox green (e), mitochondrial oxidation (f), and CRT (g) of the segmented spheroid image area of MDA-MB cells at 24 h and 48 h post gas plasma irradiation exposure. The data analysis was based on the fluorescence signals from the segmented spheroids, not taking into account the individual viability of the cells (except for sytox green). Data are from three to eight spheroids and presented as mean (min-max boxplot; ±SD). Statistical analysis was performed using one-way analysis of variances with p < .001 (***); scale bar is 300 µm
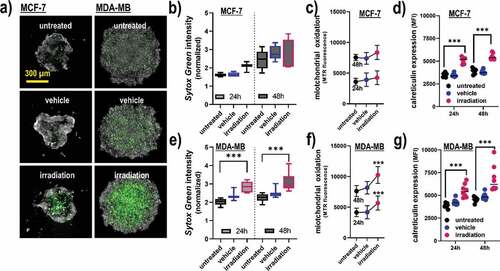
Figure 4. Syngeneic breast cancer animal model and tumor growth. (a-b) scheme of the animal treatment sides (a) and the timeline of the treatment of the breast cancer animal model (b); (c-d) Kaplan-Meier survival curve (c) and area under the curve (d) of the curves; (e) tumor sizes of individual mice of the control group (black) and the gas plasma-irradiated group carrying one tumor on each flank, one being subjected to gas plasma irradiation treatment (magenta) and the tumor on the opposite side remaining untreated (turquoise); (f-g) mean tumor growth (f) and weight (g) of the untreated tumors, gas plasma irradiation-treated tumors as well as untreated opposite flank tumors of the same mice; (h-i) representative images of ultrasound (sonography) measurements of the tumors (h), and of a representative mouse of each group using computer tomography (CT). Data are from eight mice per group. Statistical analysis was performed using one-way analysis of variances with p < .05 (*) and p < .01 (**)
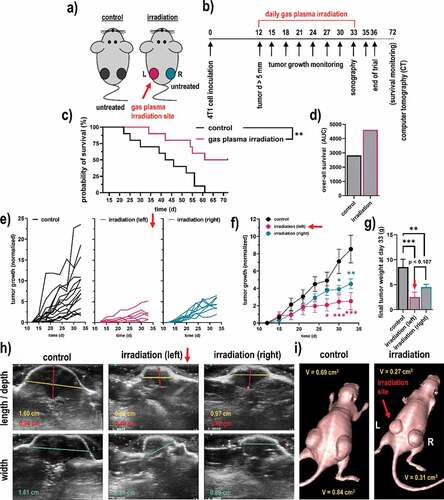
Figure 5. Quantitative imaging analysis of apoptosis, immune cell infiltrates, and CRT in breast cancer tissues. (a) representative images of tumor tissue sections stained with DAPI (nuclei, blue) for all cells and TUNEL (green) for apoptotic cells; (b-c) quantitative image analysis of TUNEL+ (b) and caspase 3+ (c) cells in tissue sections; (d) representative whole tissue section image that was stained (left) with DAPI and (blue) and anti-CD8 antibodies (orange), and segmented for different image regions (right) based on algorithm-driven image processing for unsupervised detection of cells; (e-h) quantitative image analysis results obtained for objects staining positive for CD8 (e), CD4 (f), CD11 c (g), and CRT (h); (i) software detection of tissue border region with the quantification of (j) FOXP3+, and (k) IL-17+ subpopulations of CD4+ cells. The latter analysis was done for all cells staining positive for these markers, not taking into account their viability as technical limitations did not allow for such degree of multiplexing. Data show individual values and mean or min-max boxplots, or as bar graphs with mean +SEM of at least seven tumor sections per group. Statistical analysis was performed using one-way analysis of variances, or t-tests with p < .05 (*), p < .01 (**), and p < .001 (***); scale bars are 100 µm, 800 µm, and 50 µm, respectively
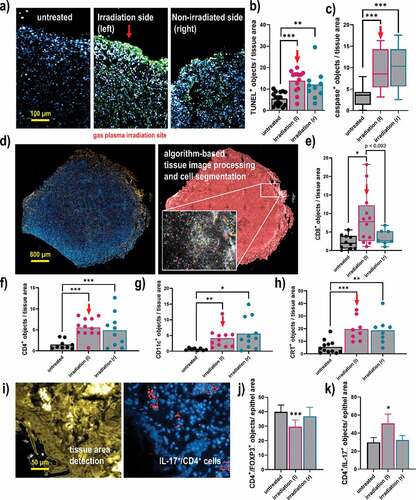
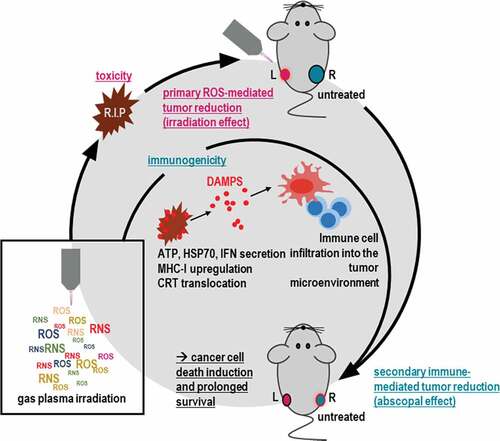
Figure 6. Scheme of gas plasma irradiation in breast cancer treatment. Gas plasma irradiation generates multiple types of ROS and RNS simultaneously, which subsequently induce cytotoxicity in breast cancer cells in vitro and in vivo. Concurrently, cell death occurs in an immunogenic fashion, leading to immune-mediated tumor reduction at a distant site not exposed to gas plasma irradiation (abscopal effect) and improved survival