Figures & data
Figure 1. Oral administration of B. breve induced tumor cell apoptosis and inhibited tumor growth. C3H/HeN mice were subcutaneously injected with 3 × 10⁶ of SCC VII cells. a. Tumor growth in C3H/HeN mice treated with PBS (control), orally taken B. breve (1 × 10⁹/mouse), L. rhamnosus (1 × 10⁹/mouse) or E. coli (1 × 10⁹/mouse) every other day from day 7. The data was presented as mean ± SEM. b. After administration for 2 weeks, the tumors were excised (left), and the tumor weight was shown in right. c. Apoptosis of tumor tissues from C3H/HeN mice was assayed with TUNEL staining and observed under fluorescence microscope (scale bar: 50 μm). The quantitative analysis of apoptotic tumor cells was performed by ImageJ software and presented in bar charts. d. The expression levels of Bax, Bcl-2, Caspase-3, and cleaved Caspase-3 in tumor tissues from C3H/HeN mice were checked by western blot assay. Densitometric analysis of protein expression was performed by ImageJ software and presented in bar charts (n = 2/group). Each dot represents one mouse in two to three independent experiments of six mice per group. Data in b and c presented as mean ± SD. Statistics were two-way ANOVA for tumor-growth curve (a) and one-way ANOVA to compare four independent groups (b, d; *P < .05; **P < .01; ns, not significant)
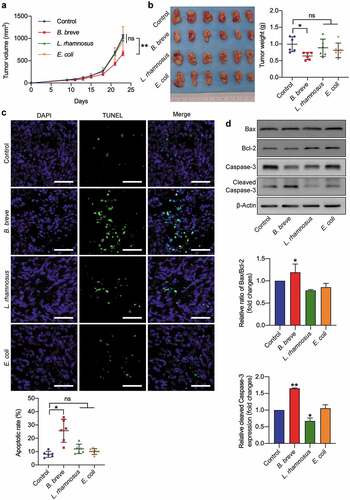
Figure 2. Tumor suppression effect depended on antitumor immunity. a. Representative H&E staining images of tumor tissues were shown in the left panel, and the expressions of CD3, CD4, and CD8 in tumor tissues were detected by immunohistochemical staining assay (left; scale bar: 50 μm). The quantitative analysis was performed by ImageJ software and the number of positive cells were presented in scatter plots (right). b. Representative plots showing gating strategy of CD3+, CD4+, and CD8+ T cells within the tumor of C3H/HeN mice, as assessed by flow cytometry (left). The statistical analysis was shown in scatter plots (right). c. The ratio of tumor infiltrating CD4+/CD3+ T cells and CD8+/CD3+ T cells based on the data in b. Each dot represents one mouse in two to three independent experiments of six mice per group. All these data were analyzed with one-way ANOVA and presented as mean ± SD (*P < .05; **P < .01; ***P < .001; ****P < .0001; ns, not significant)
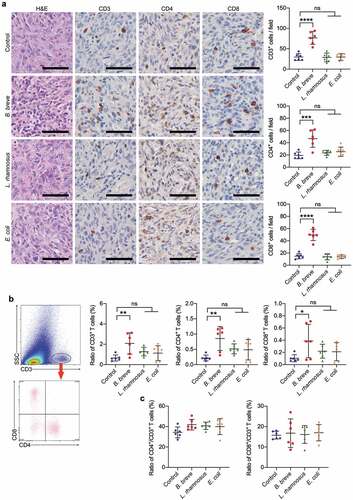
Figure 3. B. breve primed intestinal DCs recruitment and maturation. Ligated loops of C3H/HeN mice were injected with PBS, B. breve, L. rhamnosus or E. coli for 45 min. a. Cryosections of the terminal ileum were stained with CD11c (red) and DAPI (blue) and representative images were shown in (left). The quantitative analysis was performed by ImageJ software and the number of positive cells were presented in scatter plots (right). Each dot represents one ileum villus in two independent experiments of six mice per group. b. Flow cytometric analyses of total DCs (CD11c+MHC-IIhi) and the subpopulations in ileal lamina propria from C3H/HeN mice. Each dot represents one mouse in two independent experiments of five mice per group. c. Cryosections were immunostained for CCL20 (green) and DAPI (blue). The quantitative analysis was performed by ImageJ software and the area of positive cells were presented in scatter plots (right). Each dot represents one ileum villus in two independent experiments of six mice per group. d. Relative mRNA expression level of the intestinal DCs-related chemokine CCL20 and CX3CL1 were evaluated by qRT-PCR. e. Relative mRNA expression level of the main intestinal epithelial Toll-like receptors was evaluated by qRT-PCR. f. Relative mRNA expression level of the key molecules in TLR signaling were evaluated by qRT-PCR. All these data were analyzed with one-way ANOVA and presented as mean ± SD (scale bar: 50 μm; *P < .05; **P < .01; ***P < .001; ****P < .0001; ns, not significant)
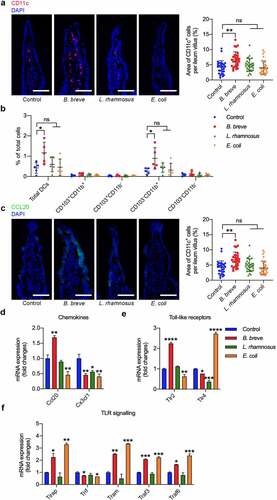
Figure 4. B. breve enhanced BMDCs development and maturation in vitro. BMDCs were stimulated for 4 hours with medium alone or with B. breve, L. rhamnosus or E. coli containing medium at a ratio of 1:100 BMDCs to bacterial cells. Relative mRNA expression level of key antitumor immunity genes in DCs were evaluated by qRT-PCR, which were crucial in DC maturation (a), DC function (b), antigen processing (c), CD8+ T cell activation and costimulation (d), type I interferon signaling (e), and immune cell recruitment (f). All these data were analyzed with one-way ANOVA and presented as mean ± SD (*P < .05; **P < .01; ***P < .001; ****P < .0001)
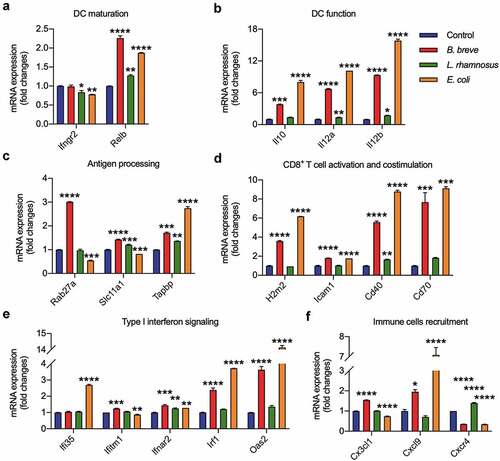
Figure 5. B. breve derived antitumor effect involved IL-12. a and b. BMDCs were stimulated with medium alone or with B. breve, L. rhamnosus or E. coli containing medium at a ratio of 1:100 BMDCs to bacterial cells. Representative plots showing gating strategy of CD11c+MHC-IIhiIL-12+ cells within the BMDCs after 8 hours stimulation, as assessed by flow cytometry (a, left). The statistical analysis was shown in scatter plots. Each dot represents one sample in two independent experiments (a, right; n = 3/group). IL-12 level in the culture supernatant from BMDCs after 24 hours stimulation, as detected by ELISA. Each dot represents one sample in two independent experiments (b; n = 3/group). c and d. Ligated loops of C3H/HeN mice were injected with PBS, B. breve, L. rhamnosus or E. coli for 45 min. IL-12 level in the ileum lysate was detected by ELISA (c). The expression of IL-12 in ileum tissues was detected by immunohistochemical staining assay and IL-12 positive cells were pointed by red arrows (d; scale bar: 50 μm). e. IL-12 level in the tumor lysate from C3H/HeN mice, as detected by ELISA. f. The expressions of IL-12 and IFN-γ in tumor tissues were detected by immunohistochemical staining assay (upper; scale bar: 50 μm). The quantitative analysis was performed by ImageJ software (lower). g. The ratio of tumor infiltrating CD45+CD11c+MHC-IIhi DCs of C3H/HeN mice. Each dot represents one mouse in two to three independent experiments of six mice per group (c, e-g). All these data were analyzed with one-way ANOVA and presented as mean ± SD (*P < .05; **P < .01; ***P < .001; ****P < .0001; ns, not significant)
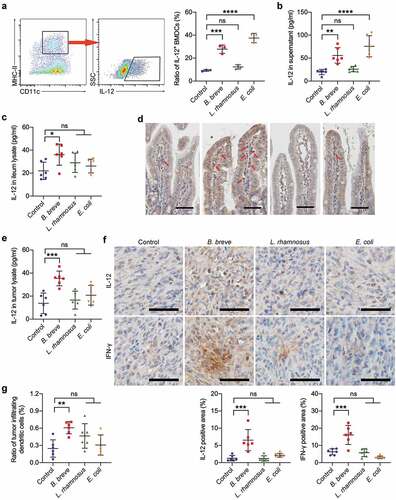
Figure 6. Antitumor effect of B. breve depended on IL-12. C3H/HeN mice were subcutaneously injected with 3 × 10⁶ of SCC VII cells. a. Tumor growth in C3H/HeN mice treated with PBS and isotype antibody (Isotype, 1 mg/mouse), orally taken B. breve (1 × 10⁹/mouse) and isotype antibody (B. breve + Isotype), neutralizing antibody for IL-12 (αIL-12, 1 mg/mouse) or both of B. breve and αIL-12 (B. breve + αIL-12). The data was presented as mean ± SEM. b. After administration, the tumors were excised (left), and the tumor weight was shown in (right); c. Apoptosis of tumor tissues from C3H/HeN mice was assayed with TUNEL staining and observed under fluorescence microscope (upper; scale bar: 50 μm). The quantitative analysis of apoptotic tumor cells was performed by ImageJ software and presented in bar charts (lower). d. The expressions of IL-12 and IFN-γ in tumor tissues were detected by immunohistochemical staining assay (upper; scale bar: 50 μm). The quantitative analysis was performed by ImageJ software (lower). Each dot represents one mouse (n = 5/group). Data in b-d were presented as mean ± SD. Statistics were two-way ANOVA for tumor-growth curve (a) and one-way ANOVA to compare four independent groups (b-d; *P < .05; **P < .01; ***P < .001; ****P < .0001; ns, not significant)
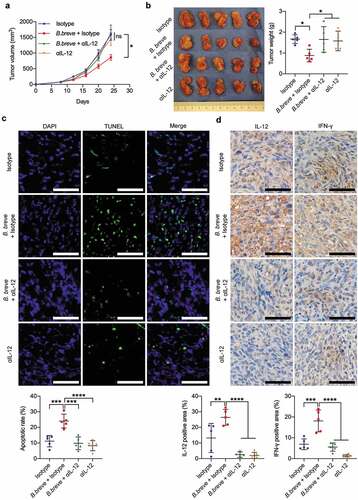
Figure 7. IL-12 blocking counteracted the increase of TILs derived from B. breve treatment. a. Representative H&E staining images of tumor tissues were shown in the left panel, and the expressions of CD3, CD4, and CD8 in tumor tissues were detected by immunohistochemical staining assay (upper; scale bar: 50 μm). The quantitative analysis was performed by ImageJ software and the number of positive cells were presented in scatter plots (lower). b. Percentage of CD3+, CD4+, and CD8+ T cells within the tumor of C3H/HeN mice from each group were assessed by flow cytometry and the statistical analysis was shown in scatter plots. Each dot represents one mouse (n = 5/group). All these data were analyzed with one-way ANOVA and presented as mean ± SD (*P < .05; **P < .01; ***P < .001; ****P < .0001)
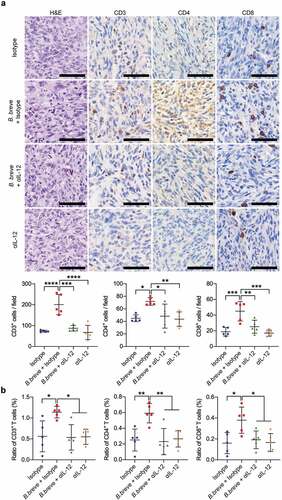
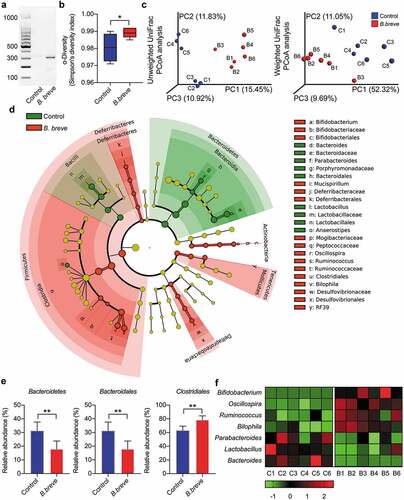
Figure 8. Oral administration of B. breve modulated intestinal microbiota in C3H/HeN mice. The C3H/HeN mice were administrated by gavage with PBS (control) or B. breve every other day and the intestinal contents were collected after 2–3 weeks to detect the intestinal microbiota. C1, C2, C3, C4, C5, and C6 belonged to the control group, B1, B2, B3, B4, B5, and B6 belonged to the experimental group. a. The relative abundance of B. breve was detected by PCR. b. Alpha diversity (Simpson’s diversity index) of the two group. c. Three-dimension ordination group of unweighted and weighted UniFrac PCoA analysis, in which distances between the samples represented the differences of them. d. The classification tree of different species between the two groups based on LEfSe. e. At the phylum level, the abundance of Bacteroidetes was analyzed. At the order level, the abundances of Bacteroidales and Clostridiales were analyzed. f. The heatmap with normalization of relative abundance at the genus level was indicated from green (less) to red (more). All these data were analyzed with two tailed Student’s t test and presented as mean ± SD (*P < .05; **P < .01)