Figures & data
Figure 1. Identification of HLA class I neoantigens that are naturally presented by microsatellite instability-colorectal cancer (MSI-CRC) cells. (A) Left, a pie chart showing the proportion of neoantigens in the entire HLA class I peptide repertoire detected by proteogenomic HLA ligandome analysis using mass spectrometry in HCT15/β2 m cells. Numbers in parentheses indicate the number of non-redundant peptides. Right, isolated HLA class I ligands were classified according to HLA type based on NetMHCpan-4.1%Rank scores. Each red dot represents detected neoantigens assigned to the indicated HLA types. (B) Differential gene expression between the whole transcriptome and source genes encoding HLA ligands in the transcriptome (*** p<.001, two-tailed t-test). Each red dot represents the distribution of source genes encoding neoantigens
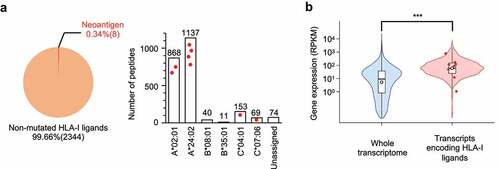
Table 1. Sequences and properties of neoantigens that are naturally presented by HLA class I of HCT15/β2m cells
Figure 2. Immunogenicity of HLA class I neoantigens inducing healthy donor (HD)-naive CD8+ T-cell responses. Naive CD8+ T cells derived from HD-PBMCs were stimulated with autologous dendritic cells (DCs) pulsed with a cocktail of HLA-A24 neoantigens along with CMVpp65. On days −1 (before stimulation) and 11 (after stimulation), the frequency of reactive CD8+ T cells was measured using the corresponding peptide-HLA-A24 tetramers. (A) Representative responses of T-cell induction in HD5 cells. Numbers indicate the proportion of tetramer-positive CD8+ cells. (B) Summary of T-cell induction in six HD-PBMCs. The frequency of CD8+ T cells recognizing four unique HLA-A24 neoantigens before and after stimulation is shown. Asterisks indicate T-cell responses in which the frequency increased ≥ 4-fold after stimulation, with ≥ 0.1% tetramer+ CD8+ cells. (C) Peptide-HLA-A24 stability assay using T2-A24 cells in a range of indicated peptide concentrations. The change in mean fluorescence intensity (ΔMFI) was calculated as the experimental MFI minus the background MFI without a peptide pulse. The stability of neoantigens (red) and WT (blue) is shown. CMVp65 and GK12 served as positive and negative HLA-A24-binding controls, respectively. (D) Comparison of ∆MFI in a peptide-HLA class I stability assay at a peptide concentration of 1 µM. Error bars represent SEM (n = 3). *p<.05, **p<.01, ns, not significant, two-tailed t-test
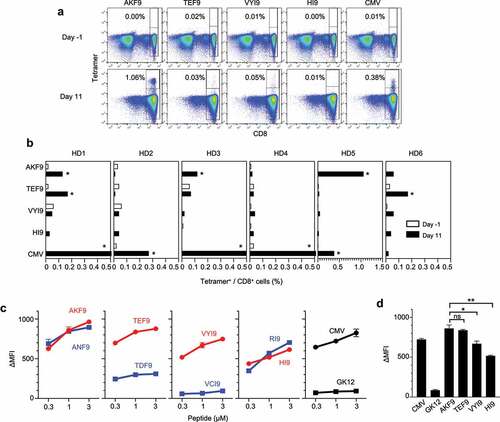
Figure 3. 3D-Modeling of AKF9 variants with single amino-acid substitutions complexed with HLA-A24. (A) Variants of the immunogenic AKF9 neoantigen, where wild-type Asn at position 8 (P8) was substituted with the indicated amino acids encoded by possible single nucleotide mutations within the wild-type codon (AAC). (B) 3D-modeling of the neoantigen-HLA-A24 complexes. Neoantigen complexes superimposed on the wild-type complex are shown. The upper and lower panels show the view from the top (T-cell contact surface) and the side (C-terminal end of the peptide) of the complexes, respectively. The ribbon diagram in gray represents the α1 and α2 helices of an HLA-A24 molecule. Stick models in light blue represent a peptide backbone with the side chains of mutated (red) and wild-type (blue) residues at P8. (C) Differences in the accessible surface area between the neoantigen and the WT (∆ASA) of AKF9 variants. Error bars represent the SEM (n = 3)
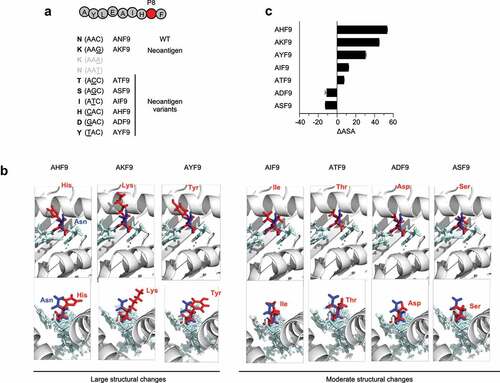
Figure 4. Immunogenic prioritization of non-anchor-type neoantigen variants with single amino-acid substitutions. (A) Peptide-HLA-A24 stability assay using T2-A24 cells in a range of indicated peptide concentrations. The change in mean fluorescence intensity (ΔMFI) was calculated as the experimental MFI minus the background MFI without a peptide pulse. (B) Representative responses of T-cell induction against AKF9 and ADF9. Numbers indicate the proportion of tetramer-positive CD8+ cells. Naive CD8+ T cells derived from HD-PBMCs were stimulated with autologous DCs pulsed with a cocktail of neoantigen variants along with the WT and CMVpp65. On days −1 (before stimulation) and 11 (after stimulation), the frequency of reactive CD8+ T cells was measured using the corresponding peptide-HLA-A24 tetramers. (C) Summary of T-cell induction in seven HD-PBMCs. The frequency of CD8+ T cells recognizing neoantigen variants or the WT before and after stimulation is shown. Asterisks indicate T-cell responses in which the frequency increased ≥ 4-fold after stimulation, with ≥ 0.1% tetramer+ CD8+ cells. The HDs with the same numbers are in common with those in
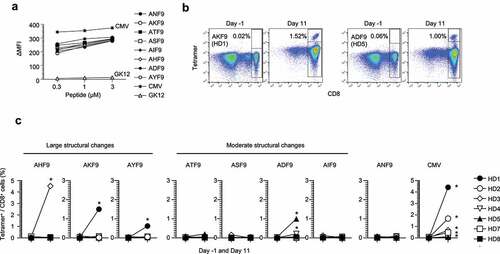
Table 2. Physicochemical properties of AKF9 neoantigen variants
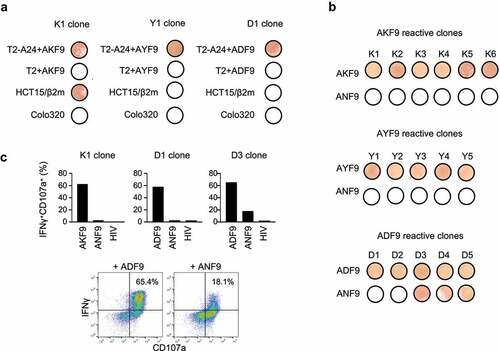
Figure 5. Functions and specificity of induced CD8+ T cells reactive to neoantigen variants. (A) IFNγ ELISpot assay of representative AKF9 (K1), AYF9 (Y1), and ADF9 (D1)-reactive CD8+ T-cell clones against T2-A24 or T2 pulsed with 20 µM indicated peptides, or cancer cells without a peptide pulse. (B) Cross-reactivity of neoantigen-reactive CD8+ T-cell clones. IFNγ ELISpot assay of established clones reactive to AKF9 (K1-K6), AYF9 (Y1-Y5), and ADF9 (D1-D5) is shown against T2-A24 pulsed with the indicated neoantigens, or the WT. (C) Intracellular IFNγ production and CD107a surface expression of neoantigen-reactive T-cell clones measured using flow cytometry. In bar graphs, the responses of the indicated clones against T2-A24 pulsed with 20 µM indicated peptides are summarized. The y-axis shows the proportions of IFNγ and CD107a double-positive cells. In the density plots, representative responses of D3 are shown. The data are representative of three independent experiments