Figures & data
Figure 1. KPC mice survival after treatment with IRE and/or DC vaccines. (a), Treatment schedule. C57BL/6 mice bearing orthotopic KPC tumors were enrolled for treatment one week after the tumor cells inoculation. Sham surgery was performed on both control and DC vaccination treatment groups. (b), Kaplan–Meier survival analysis of mice with KPC tumors treated with sham control (n = 8), IRE (n = 9), DC vaccine (n = 8), or IRE + DC vaccine (n = 11). P = .006, log-rank test
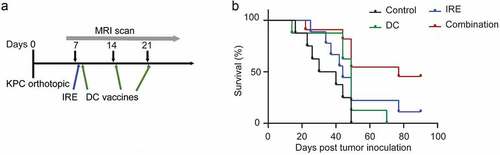
Figure 2. In vitro analyses of IRE-treated KPC cells. (a), Annexin V-FITC/PI staining of KPC cells. Cells were suspended in phosphate-buffered saline (PBS) and electroporated in a cuvette with a 4-mm gap. The parameters for electroporation were voltage = 500 or 1000 V, pulse duration = 100 μs, pulse repetition frequency = 1 Hz, number of pulses = 20. Cells were stained and analyzed within 30 min of treatment. (b), ATP concentrations in cell supernatants of untreated control, 500 V, and 1000 V groups. Data are presented as mean ± standard error of mean (SEM), n = 5. ** P = .009
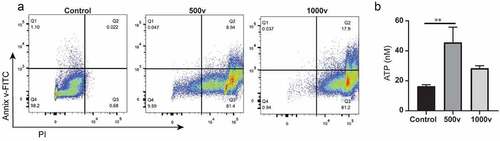
Figure 3. Comparison of tissue sections with H&E staining in (a), CK19 staining in (b), and cleaved caspase 3 staining in (c), three weeks after tumor inoculation in different groups. Scale bars in A represent 1.5 mm. Scale bars in (b)and (c)represent 100 μm. Relative quantification of CK19+ area (d) and cleaved caspase 3+ cells (e) in KPC tumors for each group. Data are presented as mean ± SEM, n = 5
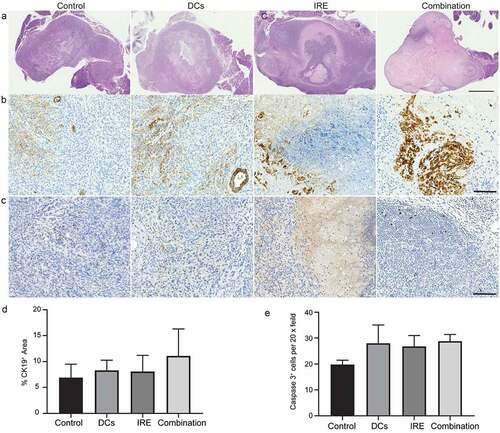
Figure 4. T2W images, diffusion-weighted images and analyses. (a), Representative T2W images of a KPC tumor-bearing mouse from each group in a separate study. MRI slices with the largest tumor cross-section are presented to show tumor size at each time point. Red contour denotes area of pancreatic tumor. (b), Representative ADC pseudocolor maps of the tumor overlaid onto a T2W image from KPC mice in different groups are shown. (c), Changes in ADC values (ΔADC2w) of KPC tumor in different groups at different time points. data are presented as mean ± SEM, n = 5. (d), Box plot shows a statistically significant difference in ΔADC between combination IRE with DC vaccine group and control KPC tumors. ***P < .001
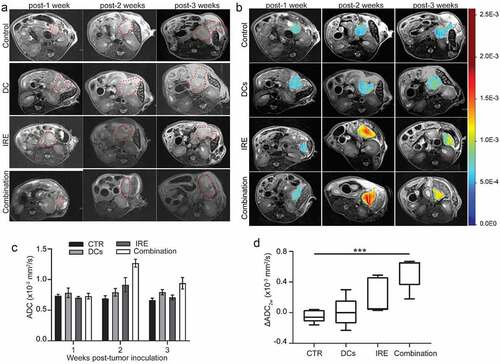
Figure 5. Trichrome staining and quantitative measurement of the fraction of fibrotic area. Representative images of trichrome staining of, (a), control, (b), DC vaccine, (c), IRE treatment, and (d), combination IRE and DC vaccine treatment three weeks after tumor inoculation. Scale bars represent 100 μm. (e), Linear correlation analyses between ΔADC2w values and histology measurement of fibrosis area. R = 0.707, P < .001. (f), Linear correlation analyses between ΔADC3w values and histology measurement of fibrosis area. R = 0.474, P = .047
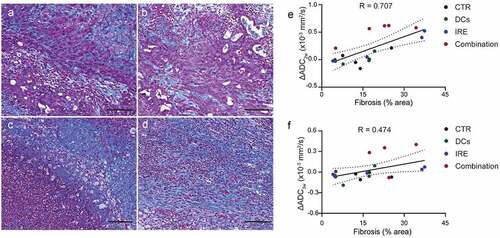
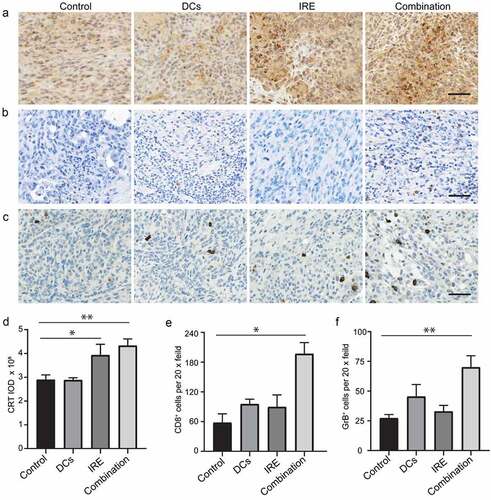
Figure 6. Intratumor immune responses of the combination of IRE and DC vaccination in KPC tumor. Representative images of tumor CRT (a), CD8 (b), and GrB (c) immunostaining after application of different treatments. Scale bars represent 40 μm. Relative quantification of CRT IOD (d), CD8+ (e) cells and GrB+ (f) in KPC tumors for each group. Data are presented as mean ± SEM, n = 5. *P < .05, ** P < .01