Figures & data
Figure 1. CD137 expression in RMS tissue cores. (a) Percentages of tissue cores with CD137 expression among different types of RMS. Number of (b) CD3+ T cells, (c) CD3+CD137+ T cells and (d) CD3−CD137+ cells in different types of RMS. Each symbol represents one patient. Lines represent medians and bars represent interquartile ranges. * p < .05 using Mann Whitney test. ARMS: alveolar rhabdomyosarcoma, ERMS: embryonal rhabdomyosarcoma, PRMS: pleomorphic rhabdomyosarcoma, SC-RMS: Spindle cell-rhabdomyosarcoma
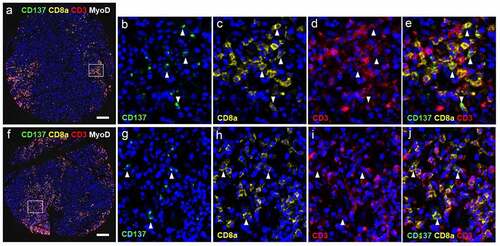
Figure 2. CD137 expression on T cells (white arrowheads) and RMS cells (red arrowheads). (a-j) Images from cores of a patient (56/M) with ERMS. A is the image from core G5. B-E are magnified images of the area highlighted in A. F is the image from core G6. White arrowheads indicate colocalization of CD3 and CD8. G-J are magnified images of the area highlighted in F. (k-r) Images from cores of a patient (50/F) with PRMS. K is the image from core F3. L-N are magnified images of the area highlighted in K. O is the image from core F4. P-R are magnified images of the area highlighted in O. Red arrowheads indicate colocalization of CD137 and MyoD. Scale bar = 400 μm
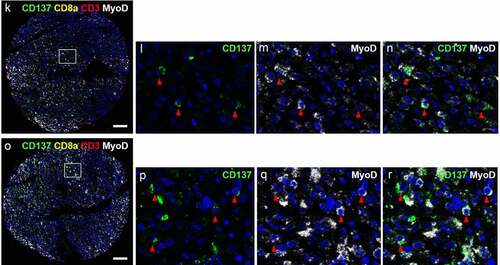
Figure 3. Induction of CD137 expression on RMS cells by TNF and CD137 signaling into RMS cells induces IL-6 and IL-8 secretion. (a) Rd18, Rh41, Rd and JR1 cells were cultured with 75 ng/ml of TNF for 24 h. CD137 expression was measured by flow cytometry. Numbers in the histogram represent percentages of cells with CD137 staining. Two independent experiments for each cell line were performed with consistent results. (b-c) CD137-expressing and parental RMS cell lines were activated with either recombinant CD137L protein or BSA (negative control) for 24 h. IL-6 and IL-8 levels were determined by ELISA. Results are pooled from three independent experiments and presented as means ± errors of means. ** p < .01 using two-sided unpaired t-test
Figure 4. Downregulation of CD137L on DG-75 by CD137-expressing RMS cells. CD137-expressing and parental RMS cells were seeded on tissue culture plates. CellTrace™ Violet-labeled CD137L-expressing DG-75 cells were added to RMS cells at a ratio of 1:2. Cells were collected 24 h later for flow cytometry. DG-75 cells without RMS cell co-culture serve as baseline. Flow cytometry results of (a) Rd18-CD137 and Rd-18 are shown. Numbers in the scatter plots represent percentages of respective cell populations. Experiments were repeated twice for each cell line with consistent results. (b) Comparison of the percentages of CD137L-expressing DG-75 cells during coculture with Rd18-CD137 and Rd18, respectively. Each symbol represents one independent experiment. Lines represent means ± standard errors of means. * p < .05 using two-sided unpaired t-test. Experiments were repeated four times for each cell line with consistent results. (c) Coculture as in (A) but with Rh-41 instead of Rd18 and cells
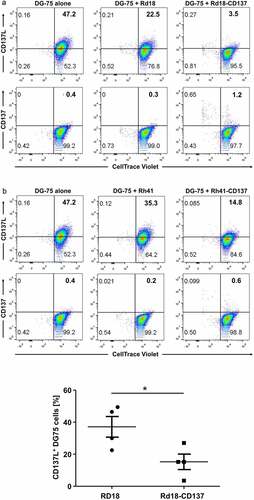
Figure 5. Downregulation of CD137 expression on T cells with reduced RMS killing and cytokine secretion. PBMCs isolated from 4 healthy donors were activated with 0.5 ng/ml of anti-CD3 antibody, and cultured with either Rd18-CD137 or parental Rd18 cells for 3 days. Cells were harvested on days 1, 2 and 3 and analyzed by flow cytometry. PBMCs without the RMS cell co-culture provided the baseline. T cells were gated by positive CD3 staining, and RMS cells were gated by negative CD45 staining. Viable RMS cells were defined as CD45−, Annexin V−, 7-AAD− and the number of viable cells was calculated using counting beads. (a) CD137 and CD69 expression on T cells of one donor is shown. Numbers in the histogram represent percentages of cells with CD137 or CD69 staining. (b) Normalized ratios (Rd18-CD137/Rd18) of percentages for CD137 and CD69 expression. (c) Number of viable RMS cells at day 2 and day 3. (d) Normalized ratios (Rd18-CD137/Rd18) of cytokine levels at day 1, 2 and 3 of co-culture. Each symbol represents one donor. A ratio of 1 (dotted line) indicates no difference between Rd18-CD137 and Rd-18 control. Lines and bars represent means ± standard errors of means. * p < .05 and ** p < .01 using two-sided unpaired t-test
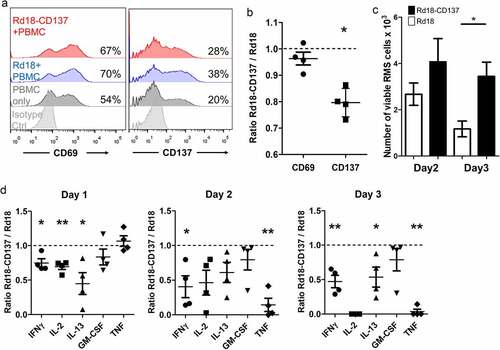
Figure 6. Anti-CD137 CAR-KHYG-1 cells specifically kill CD137-expressing RMS cells. 5000 RMS cells were co-cultured with KHYG-1 cells at a ratio of 1:10 for 24 h. The supernatants were collected for the measurement of LDH activities and cytokine levels. (a) Percentages of RMS cell lysis (b) IFNγ level (c) TNF level. Top row: Rd18 cells, bottom row: Rh41 cells. Results are pooled from three independent experiments and presented as means ± standard errors of means. ** p < .01 using two-sided unpaired t-test
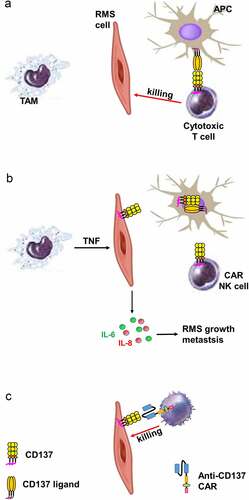
Figure 7. Schematic diagram illustrating the proposed role of CD137 in RMS. (a) Via CD137L – CD137, APC costimulate activated T cells which kill RMS cells. (b) TAM induce ectopic CD137 expression on RMS cells via TNF. CD137 on RMS cells downregulates CD137L on APC via trogocytosis, reducing T cell costimulation and thus anti-tumor response. CD137 signaling into RMS cell induces secretion of IL-6 and IL-8 which drive RMS growth and metastasis. (c) NK cells transduced with an anti-CD137 CAR kills RMS cells that ectopically express CD137