Figures & data
Figure 1. Measurement of total IgG4 sera levels in all the different cluster of donors. Total IgG4 levels of healthy donors, primary cancer patients and metastatic patients were measured. After z-normalization significantly higher total IgG4 sera levels (zIgG4) were found in metastatic compared to primary tumor patients (p = .01109). One-way ANOVA with Tukey post-hoc test was performed. n.s. P > .05, * P < .05
Figure 2. Evaluation of total zIgG4/-zIgE ratio and of total zIgG1/-zIgE ratio. Total IgG4, IgG1 and IgE levels of healthy donors, primary cancer patients and metastatic patients were measured. After z-normalization of all their values, we calculated the total zIgG4/-zIgE ratio in comparison with total zIgG1/-zIgE ratio. (a) Significantly higher values of total zIgG4/-zIgE ratio were found in metastatic compared to primary tumor patients (p = .0009433) and to healthy donors (p = .02474). (b) No significant differences were found when we evaluated the total zIgG1/-zIgE ratio. One-way ANOVA with Tukey post-hoc test was performed. n.s. P > .05, # P < .1, * P < .05, *** P < .001, **** P < .0001
Figure 3. Receiver operating characteristic (ROC) analysis of serum total zIgG4/-zIgE ratio and of total zIgG1/-zIgE ratio. Receiver operating characteristic (ROC) analysis of total zIgG4/-zIgE and total zIgG1/-zIgE was performed using R package “ROCit”. (a) Binormal ROC curves were constructed for diagnostic performance considering total zIgG4/-zIgE in metastatic patients versus primary tumor patients. Youden Index point was calculated to determine the optimal cutoff for the diagnosis of metastases. Area under the ROC curves (AUC) = 0.83438, False Positive Rate (FPR) = 0.30, True Positive Rate (TPR) = 0.83. (b) Binormal ROC curves were constructed and Youden Index point was calculated also for total zIgG1/-zIgE in metastatic patients versus primary tumor patients. Area under the ROC curves (AUC) = 0.69702, False Positive Rate (FPR) = 0.50, True Positive Rate (TPR) = 0.83
Table 1. ROC binormal analysis of CRC tumor patients
Figure 4. Evaluation of IgG4 expression in CRC tumor site. (a) One representative immunohistochemistry staining of formalin fixed paraffin embedded colon cancer slides against IgG4 (brown spots). (b) Highlighted area in red was magnified and IgG4 (brown spots) are marked with white arrows. (c) Quantification of IgG4 cell positivity in ten different tumor slides. We found significantly more IgG4 positive cells in the stroma site than in the tumor site microenvironment (Paired two tails Student’s t test, p < .0001). (d) One representative IF staining of formalin fixed paraffin embedded colon cancer slides against CD38 positive B cells (green), against IgG4 (red), and against CD68 positive macrophages cells (white). (e) Highlighted area in red was magnified to show the close contact between CD38+ green B cell expressing IgG4 (red spots) and CD68+ (white) macrophages
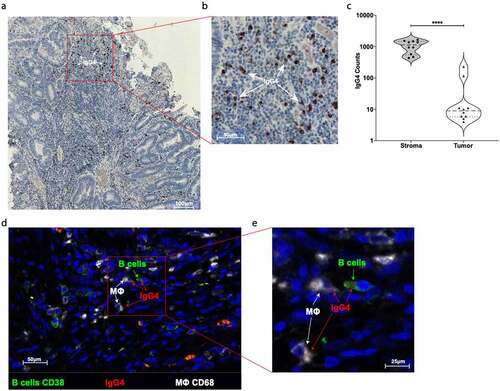
Figure 5. Production of M2b-like cytokines/chemokines by M2a macrophages treated with mIgG1 or mIgG4 antibodies. The supernatants of monocyte-derived macrophages (MDM) from the PBMCs of healthy donors or primary tumor patients or metastatic tumor patients were polarized ex vivo for 72 h. M2a macrophages treated ex vivo with plate-bound myeloma IgG1 (mIgG1) or plate-bound myeloma IgG1 (mIgG4) or left untreated were evaluated by cytokine ELISA for the detection of CCL-1, IL-10 and IL-6 production. Our results showed an increase of CCL-1, IL-10 and IL-6 production by M2a macrophages treated with mIgG4, similarly to M2b-like cytokine and chemokine production. These findings were true for all PBMC donor groups. The z‐normalization of pg/ml concentration was performed for each marker and each donor before the statistical validation. Gray bars: unstimulated M2a cells; white bars: M2a cells + mIgG1; black bars: M2a cells + mIgG4. The results from thirty-one independent experiments were combined for statistical analysis. One-way ANOVA with Tukey post-hoc test was performed. n.s. P > .05, * P < .05, ** P < .01, *** P < .001, **** P < .0001
Figure 6. Anti-human EGFR-IgG1 or IgG4 subclass effects on the ADCP and ADCC of tumor cell lines by human U937 monocytes. U937 in vitro mediated mainly ADCP (a) and lower levels of ADCC (b) of EGFR differently expressing A431, HT-29 and CaCo2 tumor cell lines (c). The percentage of tumor dead cells was evaluated by flow cytometric analysis following the gating strategy represented on Repository figure 2. Black bars: A431 cells; white bars: HT-29 cells; gray bars: CaCo2 cells. The results from three independent experiments were combined for statistical analysis. One-way ANOVA with Tukey post-hoc test was performed. ** P < .01