Figures & data
Figure 1. Opal multiplex analysis of human ESCC identifies different immune subpopulations. (a and b) Representative images displaying the same TMA cores of tumor after multispectral merged imaging for panel A (a) and panel B (b). (c) Magnified subsection of the core outlined in (a) (green, CD11c; red, CD45RO; magenta, CD68; cyan, panCK; orange, PD-L1 and blue, DAPI). (d) Magnified subsection of the core outlined in (b) (yellow, CD4; orange, CD8; cyan, CD56; red, FoxP3; green, granzyme B and blue, DAPI). (e and f) Composite image subjected to tissue segmentation (e) and cell segmentation (f). (g and h) Representative images displaying the same TMA cores of uninvolved tissue after multispectral merged imaging for panel A (g) and panel B (h). All scale bars equal 200 μm
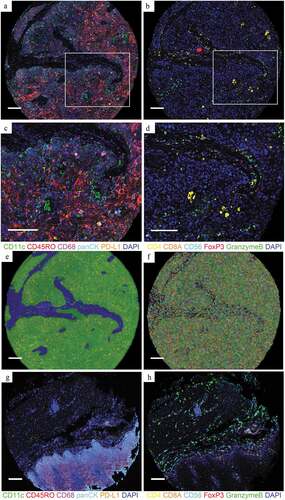
Figure 2 ESCC tissue samples display heterogeneous populations of immune cell infiltrates. (a-f) Pairwise comparisons of the ratio of immune subpopulations in intraepithelial regions and stromal regions per patient for PD-L1+ cells (a), PD-L1+ EC/EC ratio (b), PD-L1+ TAM/TAM ratio (c), TAMs (d), DCs (e) and memory T cells (f) between tumoral (n=269 for IE, n=268 for ST) and peritumoral uninvolved esophageal tissue samples (n=42 for IE and ST). (g-k) CTLs (g), aCTL/CTL ratio (h), Ths (i), Tregs (j) and NK cells (k) between tumoral (n=220 for IE, n=224 for ST) and peritumoral uninvolved esophageal tissue samples (n=35 for IE, n=32 for ST). Significance was determined by an unpaired t-test. Data are presented as the mean ± standard deviation (s.d.). ***P<0.001, NS, not significant. IE, intraepithelial. ST, stromal
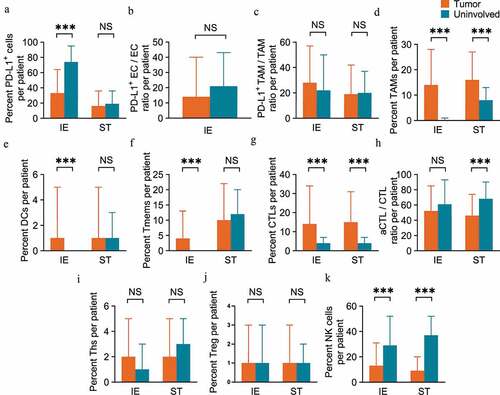
Figure 3. Immune cell infiltration in intraepithelial and stromal regions stratifies patient OS. (a-j) Overall survival analysis of patients based on the percentage of cell numbers per patient of intraepithelial (n=170 for low, n=99 for high) (a) and stromal memory T cells (n=222 for low, n=46 for high) (b), intraepithelial (n=92 for low, n=128 for high) (c) and stromal CTLs (n=110 for low, n=114 for high) (d), intraepithelial (n=110 for low, n=110 for high) (e) and stromal aCTLs (n=77 for low, n=147 for high) (f), stromal Tregs (n=179 for low, n=45 for high) (g) and intraepithelial (n=110 for low, n=110 for high) (h), PD-L1+ ECs (n=210 for low, n=59 for high) (i) and intraepithelial PD-L1+ TAMs (n=220 for low, n=49 for high) (j). Significance was determined using the log-rank test and Kaplan-Meier survival curves are presented. IE, intraepithelial. ST, stromal. OS, overall survival. DFS, disease free survival
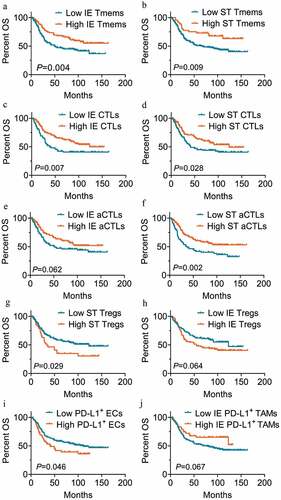
Figure 4. Immune cell infiltration in intraepithelial and stromal regions stratifies patient DFS. (a-c) Disease free survival analysis of patients based on the percentage of cell numbers per patient of intraepithelial PD-L1+ TAM (n=220 for low, n=49 for high) (a), stromal aCTLs (n=77 for low, n=147 for high) (b) and Tregs (n=179 for low, n=45 for high) (c). High and low infiltration groups were divided based on the cutoff value suggested by X-tile or the median percentage of the ratio when X-tile suggested 0 for the cutoff value. Significance was determined using the log-rank test and Kaplan-Meier survival curves are presented. IE, intraepithelial. ST, stromal. DFS, disease free survival
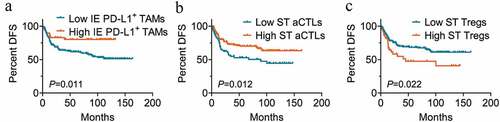
Table 1. Univariate analysis of clinicopathological factors for overall survival and disease free survival in ESCC
Table 2. Multivariate survival analysis of immune infiltration level and clinicopathological factors for overall survival
Table 3. Multivariate survival analysis of immune infiltration level and clinicopathological factors for disease free survival
Figure 5. AUC comparison between Cox models of immune infiltration and clinicopathological factors combined and TNM stage only for ESCC prognosis prediction. (a-c) ROC curves of prognostic models combing immune infiltrates and clinicopathological factors or TNM stage only for OS at 1 year (a), 3 years (b) and 5 years (c). (d-f) ROC curves of prognostic models combing immune infiltrates and clinicopathological factors or TNM stage only for DFS at 1 year (d), 3 years (e) and 5 years (f). ROC, receiver operating characteristics; AUC, area under curve. TNM, tumor-node-metastasis. OS, overall survival. DFS, disease free survival
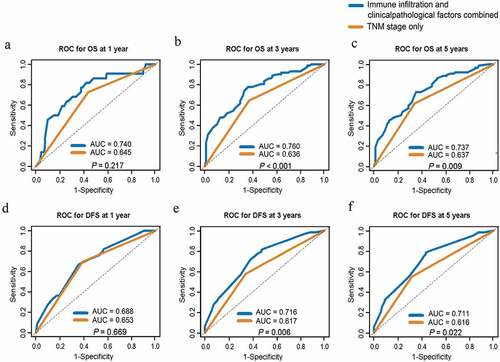
Figure 6. Tregs are associated with decreased antitumor effector infiltration. (a-c) Pairwise comparisons of the percent of cell counts for CTLs (a), aCTLs (b) and NK cells (c) between the high (n=110) and low Treg infiltration groups (n=110) in intraepithelial regions per patient. (d-f) Pairwise comparisons of the percent of cell counts for CTLs (d), aCTLs (e), and NK cells (f) between the high (n=45) and low Treg infiltration groups (n=179) in stromal regions per patient. Significance was determined by an unpaired t-test. Data are presented as the mean ± standard error of the mean (s.e.m.). *P<0.05, **P<0.01, ***P<0.001. IE, intraepithelial. ST, stromal
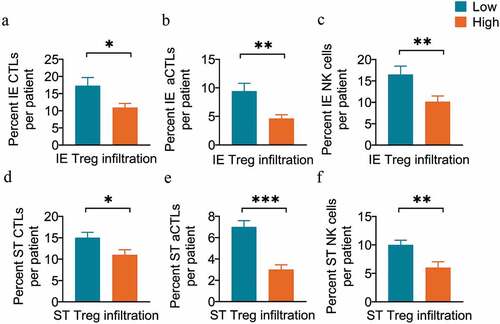
Figure 7. Memory T cells are associated with other immune populations in intraepithelial regions. Correlation analysis between the percent of cell counts for memory T cells and other populations, including CTLs (a), Ths (b), Tregs (c), DCs (d), PD-L1+ cells (e), PD-L1+ ECs (f), and PD-L1+ TAMs (g) in intraepithelial regions per patient. The Spearman correlation coefficient (rs) and significance levels (P value) are presented for each correlation and area between the dashed line for the 95% CI. IE, intraepithelial. ST, stromal
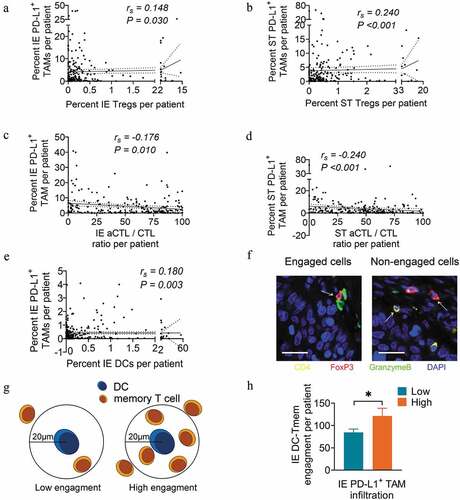
Figure 8. PD-L1+ TAM infiltration is associated with the infiltration and engagement level of other immune populations. (a and b) Correlation analysis between the percent of cell counts for PD-L1+ TAMs and Tregs in intraepithelial (a) and stromal (b) regions per patient. (c and d) Correlation analysis between the percent of cell counts for PD-L1+ TAMs and aCTL/CTL ratio in intraepithelial (c) and stromal (d) regions per patient. (e) Correlation analysis between the percent of cell counts for PD-L1+ TAMs and DCs in intraepithelial regions per patient. (f) Schema depicting engaged or nonengaged immune cells. (g) Schema depicting low or high memory T cell engagement within a radius of 20 μm from the nucleus of an DC at the center. (h) Pairwise comparison of DC-memory T cell engagement levels between the high (n=41) and low PD-L1+ TAM infiltration groups (n=177) in intraepithelial regions per patient. Spearman correlation coefficient (rs) and significance levels (P value) presented for each correlation and area between dashed line for 95% CI. In pairwise comparisons, significance was determined by an unpaired t-test, and data are presented as the mean ± s.d. *P<0.05. IE, intraepithelial. ST, stromal. All scale bars equal 20 μm