Figures & data
Figure 1. Kaplan–Meier survival curves of patients with HNSCC who received durvalumab and had evaluable biomarker data at baseline in HAWK (n = 106), CONDOR (n = 52), and EAGLE (n = 209) clinical trials. The p value obtained from log-rank test is p = .74
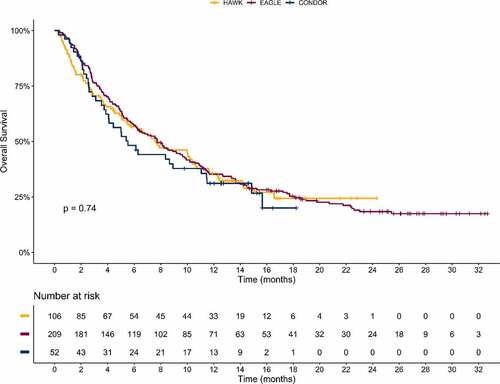
Table 1. Covariate distribution of patients with HNSCC at baseline split by study and dataset (discovery and validation, respectively)
Figure 2. Correlation of angiogenic and immunomodulatory proteins with OS of durvalumab-treated HNSCC patients in HAWK and CONDOR trials. Stepwise feature selection and Cox proportional hazards modeling identified independent association of baseline concentrations of an angiogenic biomarker (ANGPT2), three immunosuppressive proteins (IL-6, CRP, S100A12), and an immunostimulatory hormone (osteocalcin) with OS in 158 patients with HNSCC receiving durvalumab. Only statistically significant factors are presented with p values shown on the right side of the HR forest plot. Global p value from the log-rank test, Akaike Information Criteria (AIC), and concordance index of the model are shown at the bottom of the plot
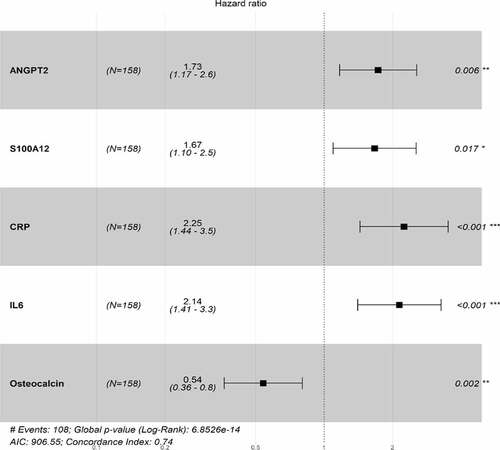
Figure 3. Significant association of protein biomarkers with OS maintained after adjusting for clinical factors in HAWK and CONDOR dataset. Forest plot of HRs is shown with individual p values on the right side. Global p values, AIC, and concordance index are shown at the bottom
Figure 4. Kaplan–Meier OS curves of immunomodulatory and angiogenic protein concentrations above or below median at baseline for the HAWK and CONDOR discovery dataset (a–h). (b) Kaplan–Meier OS curves of immunomodulatory and angiogenic protein concentrations above or below median at baseline for the EAGLE validation dataset (i–p)
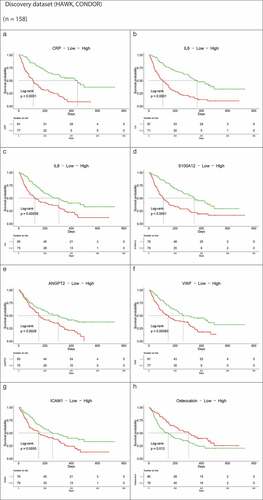
Figure 4. (Continued)
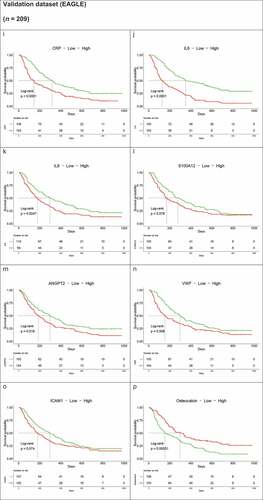
Figure 5. Forest plots of HRs following Cox regression predictors of OS discovered in the HAWK/CONDOR analysis and projected on the validation EAGLE dataset