Figures & data
Figure 1. T and B cell aggregates in untreated PDAC tumors predict overall survival. A) Histological micrographs (10x) representative of TLS+ PDAC patients from the PCI cohort. From top left to bottom right: H&E, CD3 IHC, CD8 IHC, and CD20 IHC. TLS regions are outlined in dashed white lines. B) Kaplan-Meier plots displaying overall survival stratified for TLS positivity. Every data point is shown regardless of censor. C-E) CD8 univariate (c), CD20 univariate (d) and CD20/CD3 multivariate (e) analysis for overall survival. Log-rank comparison between CD3hi/CD20hi and CD3hi/CD20low groups non-significant at p = .701. Median cut points were determined for hi vs. low infiltration for all IHC markers. L-R = Log-rank; Wil. = Wilcoxon; H.R. = Hazard ratio; CI: confidence interval. Statistical comparisons were made between all groups. If no p-value is displayed, the comparison was not statistically significant
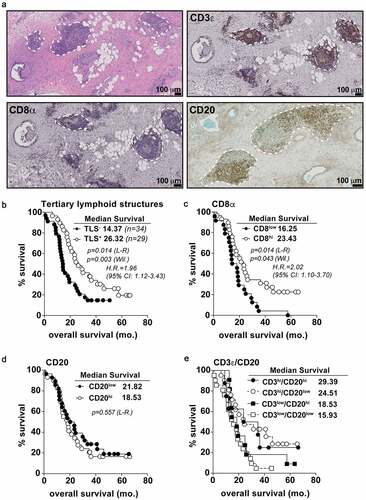
Figure 2. Early stage-TLS+ tumors are T and B cell inflamed with distinctive gene expression signatures. A) CD3+ cell density in TLS+ (n = 30) and TLS− (n = 37) PDAC tumors as determined by IHC. B) CD20+ and CD8+ cell density in surgical tumor sections grouped into TLS+ or TLS− patients as quantified from immunofluorescent imaging. C) Percent positive of CD103+CD8+ cells of total CD8+ cells in TLS+ and TLS− surgical tumor sections. D) Volcano plot comparing differentially expressed genes between TLS+ and TLS− tumors. Cutoffs are indicated by the dashed lines at 2-fold change and p < .01 values. E) Gene set enrichment analysis between TLS+ and TLS− tumors using Hallmark Gene Sets. Shown are the pathways significantly different to a false discovery rate (FDR) of 0.25 or lower. F) Unsupervised hierarchical clustering based on the top 100 most (50 upregulated and 50 downregulated) differentially expressed genes between TLS+ (red) and TLS− (blue) patients
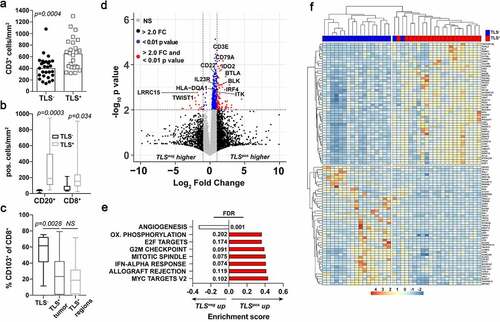
Figure 3. IgG1 class-switched memory B and CD4+ T cells subsets are enriched in TLS+ tumors. A) xCell enrichment scores for Memory B cells (i), CD4+ T memory cells. Deconvolution analysis was generated using TPM normalized RNA-seq data from whole tumor tissue sections. B) CIBERsort enrichment scores for Memory B cells (i), CD4+ T memory cells C) Kaplan-Meier analysis for overall survival and progression free survival stratifying TCGA-PDAC patients (n = 174) based on TLS positivity (TLS+ n = 44). Log-rank and Wilcoxon statistical significance are displayed within the plots. D) xCell enrichment scores for Memory B cells (i) and CD4+ T memory cells (ii) from deconvoluted TCGA RNA-seq data. E) FACS analysis on peripheral blood (groups a and b) and tumors (groups c and d) of PDAC patient samples following surgery. Shown is the mean percentage Ig isotype+ cells of total CD19+ B cells. Statistical significance is indicated within each pie comparing each group as indicated. * p < .05, ** p < .01. F) IGHC analysis from RNA-seq data as determined by the TRUST algorithm. Data is shown as the percent IGHC clone/total clones counted and displayed as box and whisker plots of the mean average and total range of the data. Statistical comparisons were made between all groups. If no p-value is displayed, the comparison was not statistically significant
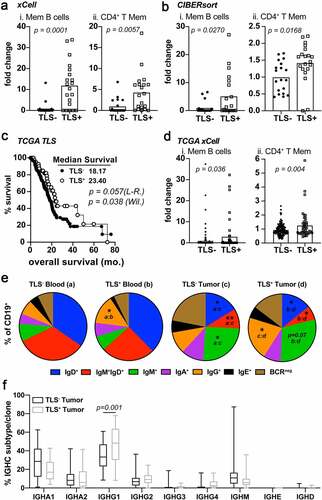
Figure 4. Germinal center reactions identify mature TLS associated long term PDAC survivorship. A-B) Representative 20x H&E micrograph (a) followed by multispectral IHC images (b) demonstrating germinal center marker expression (CD21, BCL6, Ki67) in the midst of CD3 (T cells) peripheral clusters, PNAd+ HEV, and CD20 (B cells) zones. The image on the bottom right in (B) is an example of a GC-negative, early-TLS aggregate lacking BCL6 and Ki67 B cell zones. C) Kaplan-Meier overall survival analysis comparing TLS+GC− patients (n = 20) and TLS+GC+ patients (n = 8) in the Providence upfront resectable cohort. D) CIBERsort analysis on tumor RNA-seq data was performed for both GC+ and GC− groups in the PCI cohort and significant fold enrichment changes are shown for naïve B cells, activated CD4+ T memory cells, and resting NK cells as indicated
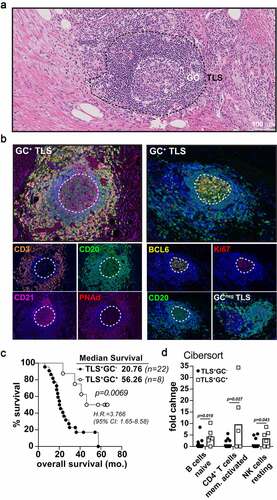
Figure 5. Predicted HLA binding neoantigens are increased in M-TLS+ PDAC patients accompanied by increased rates of B cell somatic hypermutation. A) TCGA tumor mutation burden between TLS− and TLS+ patients from the TCGA-PAAD dataset. B) Kaplan-Meier curve of TMBhi vs. TMBlow determined on a mean cut-point was used to stratify TCGA-PAAD patients for overall survival. C) Predicted strong binding (rank<0.5%) neoantigens/patient partitioned into HLA-A, B, and C specific peptides using a proprietary neoantigen prediction pipeline in conjunction with HLA-peptide affinity predictions determined by NetMHCpan version 4.0 algorithms. D) Predicted weak binding (rank 0.5–2%) neoantigens/patient partitioned into HLA-A, B, and C-specific peptides. E) BCRseq analysis as determined by the TRUST algorithm of tumor RNA-seq data from samples of TLS−, TLS+GC−, and TLS+GC+ patients. Shown is the calculated Simpsons clonality score for each patient. F) The rate of BCR somatic hypermutation is shown calculated by the number of unique mutated B cell clones per total unique B cell clones in each patient tumor. Statistical comparisons were made between all groups. If no p-value is displayed, the comparison was not statistically significant