
Figures & data
Figure 1. Expression of PD-L1 and VISTA in tumor tissues from ENKTCL patients. A-E. Representative double immunofluorescence images of CD56 (green) and PD-L1 (red) (a), CD68 (green) and PD-L1 (red) (b), CD56 (green) and VISTA (red) (c), CD68 (green) and VISTA (red) (d), and PD-L1 (green) and VISTA (red) (e). The nucleus is labeled with DAPI (blue). Arrows indicate the colocation of indicated proteins. F. The representative IHC images of PD-L1 and VISTA from serial sections. G. The correlation between PD-L1 expression and VISTA expression depicted with scatter plot. Scale bar is 50 μm
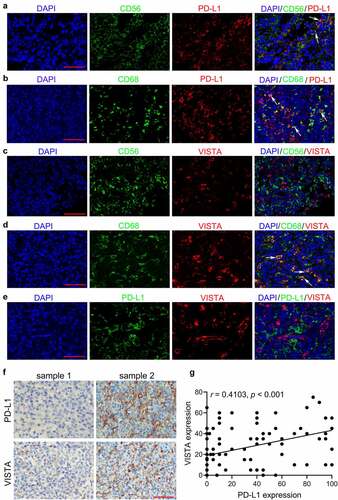
Table 1. The correlation between PD-L1 and VISTA expression and clinicopathological characteristics
Table 2. Univariate analysis of prognostic factors correlated with PFS and OS in patients with ENKTCL
Table 3. Multivariate analysis of prognostic factors correlated with PFS and OS in patients with ENKTCL
Figure 2. Kaplan-Meier survival curves for progression-free survival (PFS) and overall survival (OS) of patients with ENKTCL according to PD-L1 and VISTA expression. A-B. PFS for ENKTCL patients based on PD-L1 (a) and VISTA (b) expression. C-D. OS for ENKTCL patients based on PD-L1 (c) and VISTA (d) expression. E-F. PFS (e) and OS (f) for ENKTCL patients based on combination of PD-L1 and VISTA expression. Type I, PD-L1low/VISTAlow; Type II, PD-L1low/VISTAhigh or PD-L1high/VISTAlow; Type III, PD-L1high/VISTAhigh
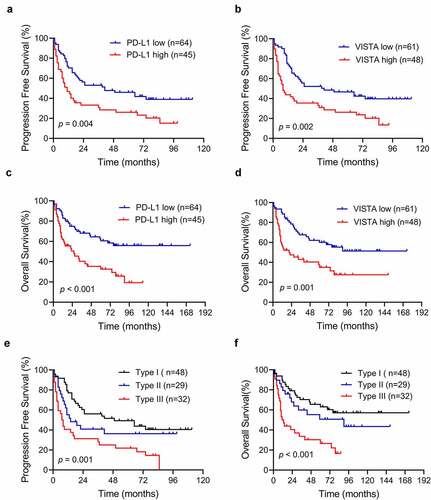
Table 4. Multivariate analysis of prognostic factors correlated with PFS and OS in patients with ENKTCL
Figure 3. The correlation between the expression of VISTA and PD-L1, and the density of tumor-infiltrating lymphocytes (TILs). A. The representative images of PD-L1, VISTA, CD8 and Foxp3 from serial sections from two samples, sample 1(up) and sample 2 (down). B-D. The correlations between CD8+ TILs and PD-L1 expression (b), VISTA expression (c) or novel immune classification (d) depicted with scatter plot. E-G. The correlations between Foxp3+ TILs and PD-L1 expression (e), VISTA expression (f) or novel immune classification (g) depicted with scatter plot. All data display mean ± SEM. Scale bar is 50 μm. *p < .05, ***p < .001. ns: no significance. Type I, PD-L1low/VISTAlow; Type II, PD-L1low/VISTAhigh or PD-L1high/VISTAlow; Type III, PD-L1high/VISTAhigh
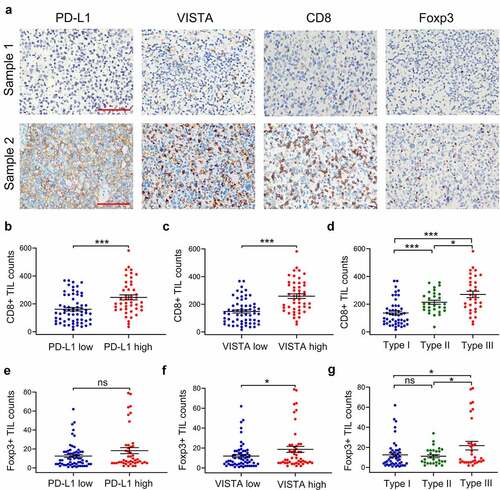
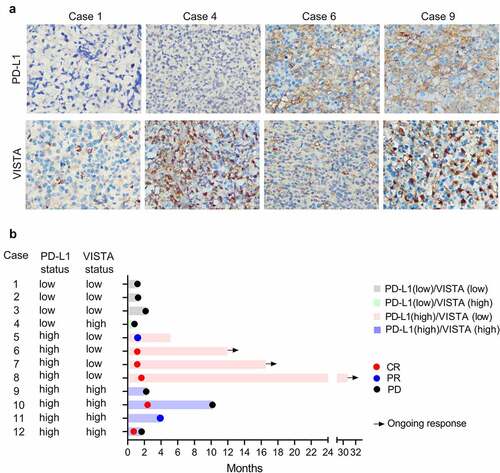
Figure 4. The PD-L1 and VISTA expression were associated with the response to blockade of PD-1. (a). The representative images of the PD-L1 and VISTA expression in indicated groups. (b). Swimmer’s plot showing the response to PD-1 blockade in extranodal NK/T-cell lymphoma patients, who were classified into four groups as indicated. CR, complete response; PR, partial response; PD, progressive disease
Supplemental Material
Download ()Availability of data and materials
All datasets used and/or analyzed during the current study are available in the Research Data Deposit public platform (www.researchdata.org.cn, number RDDB2021001093) from the corresponding author on request.