Figures & data
Figure 1. TP53 activation induces CD80 expression in human tumor epithelial cells. (a) 10 µM Nutlin-3a treatment induced CD80 expression in TP53-positive tumor cells. Levels of CD80 and CDKN1A transcripts upon Nutlin-3a treatment for 6 h were assessed by quantitative Real-Time polymerase chain reaction (PCR) in HCT116 and A549 cells (TP53-positive) and Saos2 and H1299 cells (TP53-null, transfected with pcDNA3 plasmid vector alone as control or to overexpress TP53). (b) Induction of cell surface expression of CD80 by Nutlin-3a treatment for 24 h relative to background staining determined by isotype-matched control was measured by flow cytometry. (c) Induction of CD80 protein expression by Nutlin-3a treatment for 24 h determined by western blotting. (d) CD80 expression was induced by 600 µM 5FU or 1 µM RITA treatment for 24 h in HCT116 and A549 TP53-positive cells but not in TP53-null cells. (e) Induction of cell surface expression of CD80 by Nutlin-3a was measured by flow cytometry in MCF7 and U2OS cells (TP53-positive) and HT29 cells (TP53-mutant). (f) Efficient TP53 depletion by TP53 siRNA inhibited CDKN1A induction by Nutlin-3a in HCT-116 and A549 cells as assessed by qPCR. Efficient TP53 depletion by TP53 siRNA inhibited CD80 induction by Nutlin-3a in HCT-116 and A549 cells as assessed by qPCR and flow cytometry (g) and western blotting(h). Data shown are representative results of at least 3 independent experiments. Data are presented as mean ± S.E.M. Unpaired, two-tailed Student’s t-test was used for comparison. *p < 0,05; **p < 0,01; ***p < 0,001 vs control (ctrl) or scramble siRNA
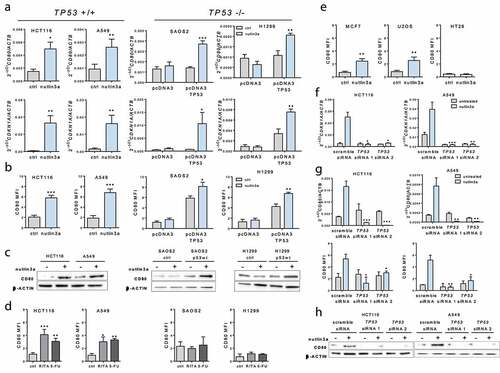
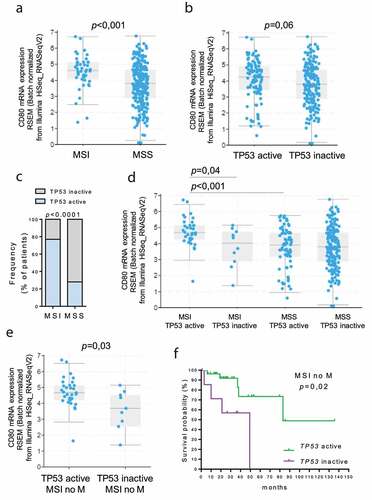
Figure 2. Correlation between TP53 status and CD80 expression in MSI colon cancer. TCGA colon adenocarcinoma dataset (total n = 291) was partitioned according to the MSI and TP53 status (Cancer Genome Atlas Network, 2018). CD80 expression was analyzed in MSI (n = 44) vs MSS (n = 247) tumors (a) and in “TP53 active” (n = 104) vs “TP53 inactive” (n = 187) group (b). P values were calculated from Student’s t-test. Data are represented as boxplots showing median and min to max values. (c) The frequency of patients with active TP53 was compared in MSI and MSS patients. Fisher exact test was performed. (d) Expression of CD80 was compared in “MSI TP53 active” (n = 34), “MSI TP53 inactive” (n = 10), “MSS TP53 active” (n = 70) and “MSS TP53 inactive” (n = 177) groups. (e) The expression of CD80 was compared in “MSI TP53 active” (n = 31), “MSI TP53 inactive” (n = 9) without distant metastasis (no M) groups. P values were calculated from Student’s t-test. Data are represented as boxplots showing median and min to max values. (f) In the MSI without metastasis group, the Kaplan‐Meier estimate was used to perform the survival analysis from the date of the initial diagnosis, and the log‐rank test was used to compare “TP53 active” and “TP53 inactive” subgroup survival