Figures & data
Figure 1. Study overview, analysis of the tumor microenvironment in patients before and after anti-PD-1 treatment with scRNA-seq, and marker ligands/receptors in specific cell types
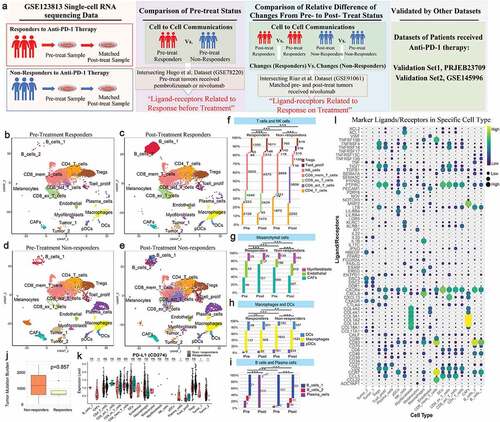
Figure 2. Comparison of pretreatment responders and nonresponders
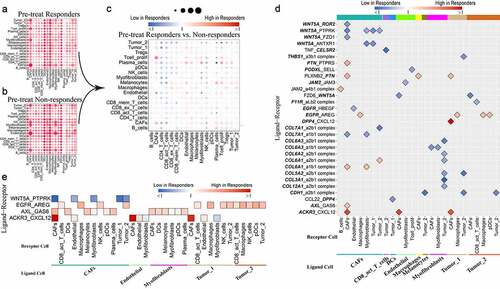
Figure 3. Relative differences in changes from pretreatment to posttreatment status between responders and nonresponders
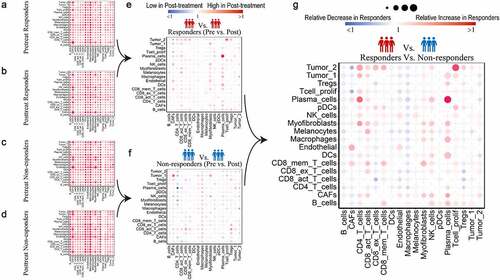
Figure 4. Relative differences in changes in specific ligand-receptor pairs between responders and nonresponders with “Relative Ratio” >2 or <0.5 (overlapping with DEGs from the Riaz et al. study)
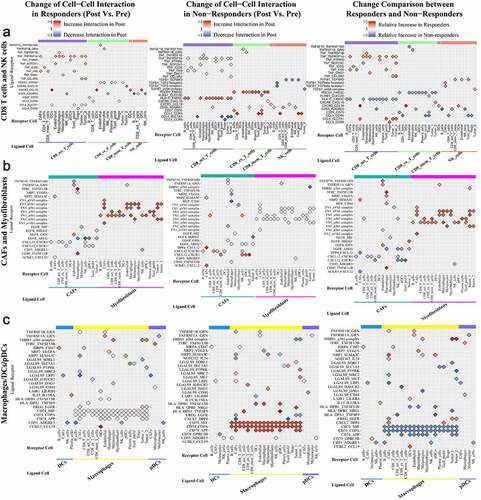
Figure 5. Relative differences in changes in specific ligand-receptor pairs between responders and nonresponders with “Relative Ratio” >2 or <0.5 (overlapping with DEGs identified in the Riaz et al. study)
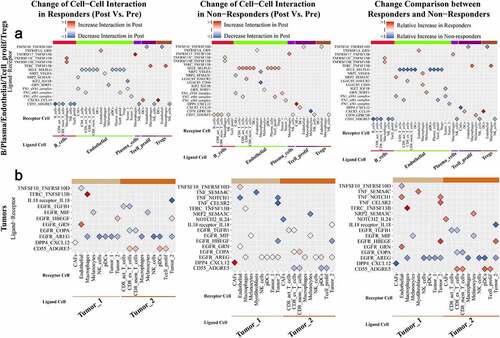
Figure 6. “Ligand-receptors Pairs Related to Response On Treatment” with significant relative differences in changes between responders and nonresponders in our study
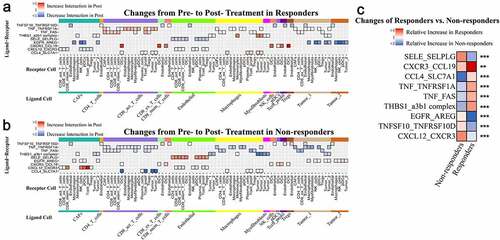
Figure 7. Trajectory Analyses of All Cell Types and Tumor-Specific CD8 T cells Using Ligand/Receptor-Related Genes
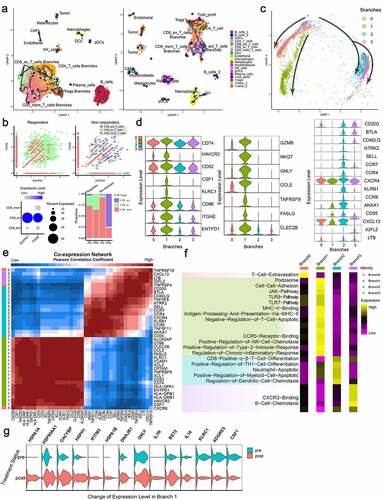
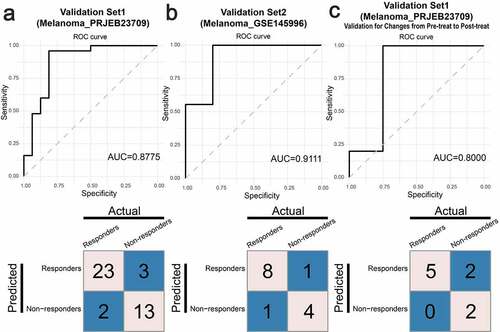
Figure 8. Validation of the “Ligand-receptor Pairs Related to Response Before Treatment” and the “Ligand-receptor Pairs Related to Response On Treatment) with additional immunotherapy datasets