Figures & data
Figure 1. Tumorigenesis induces the accumulation of splenic Gr1+CD11b+ and Gr1+CD11b+B220− cells, but not Gr1+CD11b+B220+ cells in B16 bearing mice. (a) Representative plots depicting the Gr1+CD11b+ cells, as well as Gr1+CD11b+B220− and Gr1+CD11b+B220+ subpopulations in the spleens of B16 bearing mice and healthy controls. The Gr1+CD11b+B220+ subset was further analyzed for CD19, IgM, and IgD expression. For each group, samples from 6 mice were mixed for evaluation. (b and c) Flow cytometry to detect the expression of CD3 (b) and NK1.1 (c) in splenic Gr1+CD11b+ cells derived from tumor-free and B16 bearing mice. (d and e) Comparison of the proportions of splenic Gr1+CD11b+ (d), Gr1+CD11b+B220−, (e) and Gr1+CD11b+B220+ (e) cells between healthy controls and B16 bearing mice (n = 3). All data presented in bar graphs are shown as mean ± SEM. ns, not significant; **p < .01
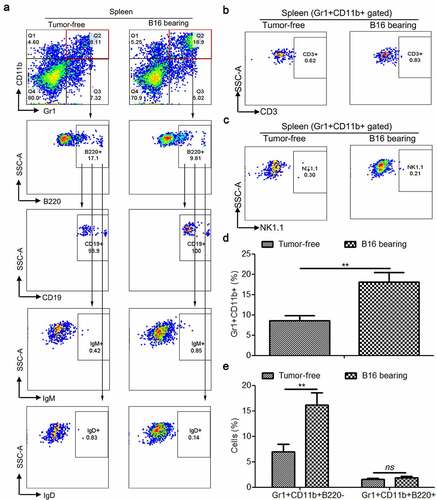
Figure 2. Only the B220− subset of MDSCs have immunosuppressive function in MDSCs during tumorigenesis in vitro. (a) Gating strategy for FACS sorting of Gr1+CD11b+B220+ and Gr1+CD11b+B220− subpopulations from the spleen tissues. (b–d) Representative images (b) and results of statistical analysis (c and d, n = 3) showing the proliferation rate of CFSE-labeled splenic CD4+ and CD8+ T cells co-cultured with Gr1+CD11b+B220− and Gr1+CD11b+B220+ cells from B16 tumor-bearing mice spleens in the presence of anti-CD3/CD28 stimulation. (e–g) The expression of Arg1, iNOS, Stat3, and p-Stat3 (e), arginase activities (f) and intracellular ROS levels (g) in Gr1+CD11b+B220− and Gr1+CD11b+B220+ cells from tumor-free or B16 tumor-bearing mice spleens. Ratios of protein band intensities (protein/β-actin), with the control sample’s normalized to 1, are shown under bands in western blot analysis. All data are shown as mean ± SEM. ns, not significant; *p < .05; **p < .01; ***p < .001
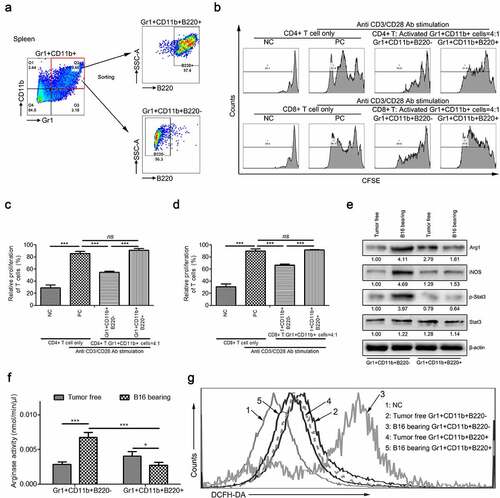
Figure 3. Gr1+CD11b+B220+ cells from tumor-bearing mice spleens show no effect on B16 and 4T1 tumor growth, but suppress distant metastasis of B16 and 4T1 tumors (a–d). Tumor growth curve (a: B16; b: 4T1) and tumor weight (c: B16; d: 4T1) of mice bearing B16 or 4T1 tumors (n = 6 per group) intratumorally injected with Gr1+CD11b+B220− or Gr1+CD11b+B220+ cells from tumor-free or tumor-bearing mice spleens. (e-h) B16 or 4T1 cells (1 × 10⁶) were intravenously injected into healthy mice for 24 days, accompanied by intravenous injection of Gr1+CD11b+B220− or Gr1+CD11b+B220+ cells (5 × 10⁵) from tumor-free or tumor-bearing mice spleens at day 5, 10, 15 and 20, respectively. Quantitative analyses of metastasized colonies in the lungs (n = 6) are shown in e (B16) and f (4T1). Quantitative analyses of metastasized colonies in the livers (n = 6) are shown in g (B16) and h (4T1). All data are shown as mean ± SEM. ns, not significant; *p < .05; **p < .01
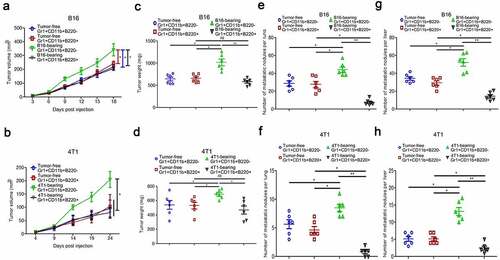
Figure 4. Gr1+CD11b+B220− and Gr1+CD11b+B220+ cells from tumor-bearing mice spleens play opposing roles in affecting cancer cell EMT and motility directly. (a–b and f–g) Wound healing assay was used to evaluate the motility of B16 or 4T1 cells co-cultured with Gr1+CD11b+B220− or Gr1+CD11b+B220+ cells from tumor-free or tumor-bearing mice spleens. The migratory distance was measured by ImageJ and compared 36 h later. a (B16) and f (4T1): representative images; b (B16) and g (4T1): quantification analysis (n = 3). (c–d and h–i) Representative pictures (c: B16; h: 4T1) and quantification analysis (d: B16; i: 4T1) to show the results of transwell migration assay in B16 or 4T1 cells co-cultured with Gr1+CD11b+B220− or Gr1+CD11b+B220+ cells from tumor-free or tumor-bearing mice spleens (n = 3). Scale bars: 100 μm. (e and j) Western blot analysis of E-cadherin, N-cadherin and Vimentin protein expression in B16 (e) or 4T1 (j) cells co-cultured with Gr1+CD11b+B220− or Gr1+CD11b+B220+ cells from tumor-free or tumor-bearing mice spleens. Ratios of protein band intensities (protein/β-actin), with the control sample’s normalized to 1, are shown under bands in western blot analysis. All data presented in bar graphs are shown as mean ± SEM. ns: Not significant; *p < .05; **p < .01; ***p < .001
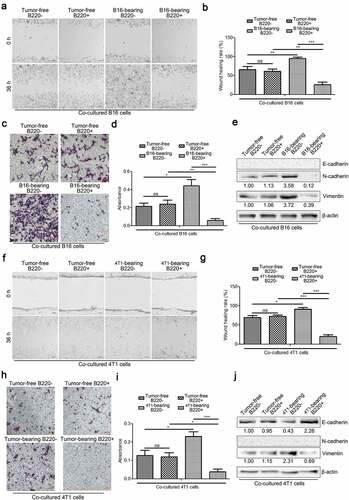
Figure 5. IL-6 deficiency impairs the accumulation of spleen- and BM-derived MDSCs by suppressing the expansion of Gr1+CD11b+B220− cells in B16 bearing mice. (a) Representative images showing the changes in the proportion of splenic Gr1+CD11b+ cells and their B220 subtypes in wild type and IL-6−/− mice with/without B16 injection. For each group, samples from 6 mice were mixed for evaluation. (b–d) The average percentages of splenic Gr1+CD11b+ (b), Gr1+CD11b+B220− (c), and Gr1+CD11b+B220+ (d) cells in samples described in a (n = 3). (e) Representative images showing the changes in the proportion of BM Gr1+CD11b+ cells and their B220 subtypes in B16 bearing wild type and IL-6−/− mice compared to healthy controls. For each group, samples from 6 mice were mixed for evaluation. (f–h) The average percentages of BM Gr1+CD11b+ (f), Gr1+CD11b+B220− (g), and Gr1+CD11b+B220+ (h) cells in samples described in e (n = 3). All data presented in bar graphs are shown as mean ± SEM. ns, not significant; *p < .05; **p < .01; ***p < .001
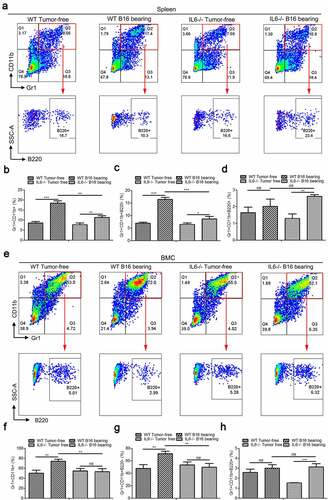
Figure 6. Intratumoral Gr1+CD11b+ cells and their B220−/B220+ subtypes in B16 tumor models of wild type and IL-6−/− mice. (a) Six wild type and IL-6−/− mice were subcutaneously injected with 5 × 10⁶ B16 cells, respectively. Growth kinetics of B16 tumors in wild type and IL-6−/− mice. (b) The average weight of tumors from each experimental group is presented. (c–d) Quantitative analysis of B16 melanoma colonies in the lungs (c) and livers (d) of wild type and IL-6−/− mice. (e) Representative FACS plots for frequency of intratumoral Gr1+CD11b+ cells and their B220 subtypes in B16 bearing wild type and IL-6−/− mice, gated on CD45+ cells. For each group, samples from 6 mice were mixed for evaluation. (f and g) Percentages of intratumoral Gr1+CD11b+ (f), Gr1+CD11b+B220− (g), and Gr1+CD11b+B220+ (g) cells in samples described in a (n = 3). All data presented in bar graphs are shown as mean ± SEM. ns, not significant; *p < .05; ***p < .001
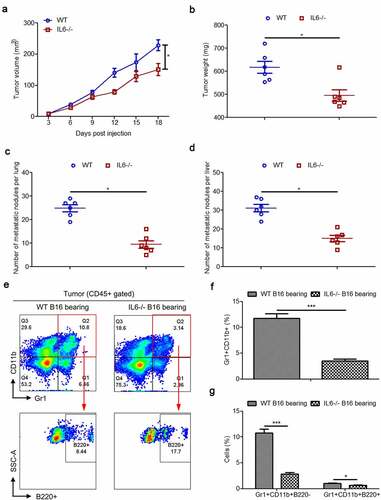
Figure 7. Splenic PMN-MDSCs, Mo-MDSCs and their B220−/B220+ subtypes in wild type and IL-6−/− mice with/without B16 injection. (a) Representative images showing the changes in the proportion of splenic PMN-MDSCs and Mo-MDSCs in wild type and IL-6−/− mice with/without B16 injection. For each group, samples from 6 mice were mixed for evaluation. (b–c) The average percentages of splenic PMN-MDSCs (b) and Mo-MDSCs (c) in samples described in a (n = 3). (d-e) Dot plots to present the B220−/B220+ subtypes of splenic PMN-MDSCs (d) and Mo-MDSCs (e) in the wild type and IL-6−/− mice with/without B16 injection. (f and g) Percentages of Ly6G+Ly6C−CD11b+B220− (f), Ly6G+Ly6C−CD11b+B220+ (f), Ly6G−Ly6C+CD11b+B220−- (g) and Ly6G−Ly6C+CD11b+B220+ (g) cells in samples described in d and e (n = 3). All data presented in bar graphs are shown as means ± SEM. ns, not significant; ***p < .001
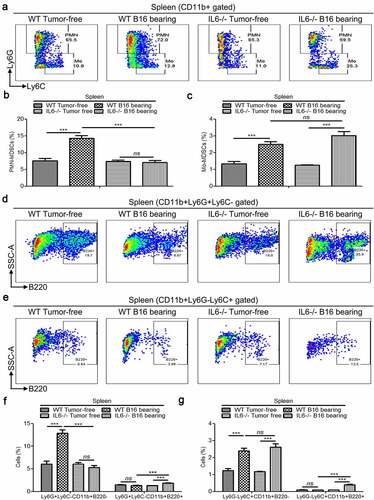
Figure 8. Determination of immunosuppressive activity of Ly6G+Ly6C−CD11b+B220−, Ly6G+Ly6C−CD11b+B220+, Ly6G−Ly6C+CD11b+B220−, and Ly6G−Ly6C+CD11b+B220+ cells from B16 tumor-bearing mice spleens. (a–c) Representative images (a) and statistical analysis results (b and c, n = 3) showing the proliferation rate of CFSE-labeled splenic CD4+ and CD8+ T cells co-cultured with Ly6G+Ly6C−CD11b+B220−, Ly6G+Ly6C−CD11b+B220+, Ly6G−Ly6C+CD11b+B220−, and Ly6G−Ly6C+CD11b+B220+ cells from B16 tumor-bearing mice spleens in the presence of anti-CD3/CD28 stimulation. These cells were sorted from the spleens of mice subcutaneously injected with 5 × 10⁶ B16 cells for 15 days. (d–e) Representative pictures (d) and quantification analysis (e) showing the results of the transwell migration assay in B16 cells co-cultured with Ly6G+Ly6C−CD11b+B220−, Ly6G+Ly6C−CD11b+B220+, Ly6G−Ly6C+CD11b+B220−, and Ly6G−Ly6C+CD11b+B220+ cells from B16 tumor-free or tumor-bearing mice spleens (n = 3). Scale bars: 100 μm. All data are shown as mean ± SEM. ns: Not significant. *p < .05; **p < .01; ***p < .001
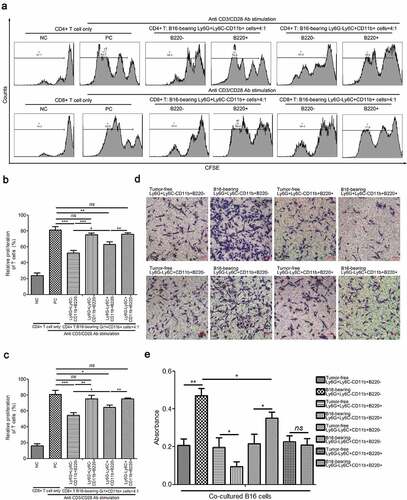
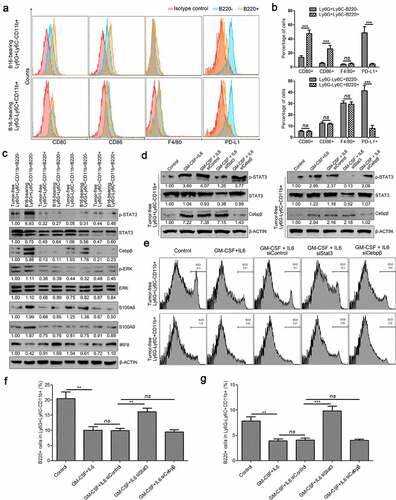
Figure 9. Characterization of B220+/B220− subsets of Ly6G+Ly6C−CD11b+ and Ly6G−Ly6C+CD11b+ cells. (a-b) The expression of CD80, CD86, F4/80, and PD-L1 in Ly6G+Ly6C−CD11b+B220−, Ly6G+Ly6C−CD11b+B220+, Ly6G−Ly6C+CD11b+B220−, and Ly6G−Ly6C+CD11b+B220+ cells from B16 tumor-bearing mice spleens, analyzed by flow cytometry. Representative flow cytometric results are shown in a. Percentage of CD80+, CD86+, F4/80+ and PD-L1+ cells are shown in B. (c) Western blot analysis of p-Stat3, total-Stat3, Cebpβ, p-ERK, ERK, S100A8, S100A9, and IRF8 inLy6G+Ly6C−CD11b+B220−, Ly6G+Ly6C−CD11b+B220+, Ly6G−Ly6C+CD11b+B220−, and Ly6G−Ly6C+CD11b+B220+ cells from tumor-free and B16 tumor-bearing mice spleens. (d) Ly6G+Ly6C−CD11b+ and Ly6G−Ly6C+CD11b+ cells from tumor-free mice spleens were transfected with two distinct siRNAs targeting Stat3 and Cebpβ, respectively, and cultured with GM-CSF (40 ng/ml) and IL-6 (40 ng/ml) for 4 days. The protein levels of p-Stat3, Stat3, and Cebpβ were analyzed by western blot analysis. (e–g) Representative images (e) and statistical analysis results (f and g, n = 3) showing the B220−/B220+ distributions of Ly6G+Ly6C−CD11b+ and Ly6G−Ly6C+CD11b+ cells from tumor-free mice spleens cultured with GM-CSF (40 ng/ml) and IL-6 (40 ng/ml) for 4 days and transfected with control siRNA, Cebpβ siRNA, or Stat3 siRNA. Ratios of protein band intensities (protein/β-actin), with the control sample’s normalized to 1, are shown under bands in western blot analysis. All data are shown as mean ± SEM. ns: Not significant. **p < .01; ***p < .001