Figures & data
Figure 1. Vaccination with TAA-loaded BMDCs induces T cell mediated antitumor immune response (n=4-5 per group). (A) Scheme of B16 melanoma inoculation followed by combination treatment with DC vaccination and adoptive T cell transfer starting on day seven after tumor inoculation. Flow cytometry analysis was performed five days after first or second DC vaccination respectively. (B) Tumor growth curves of treated mice measured from two days before until ten days after start of treatment. (C) Correlation of final tumor sizes to tumor infiltrating CD45.2+CD11c+ DCs. (D-E) Flow cytometry analysis of frequencies of injected CD45.2+ DCs among all CD11c+ DCs (D) and CD90.1+CD8+ pmel T cells among all CD3+ T cells (E) in the tumor, tdLN and the spleen as measured five days after first or second vaccination. All data are presented as mean SEM. For (B), (D) and (E) we performed a two-tailed student’s t test to determine statistical significance (* p<0.05; ** p<0.01, *** p<0.001, **** p<0.0001). For (C) we calculated Pearson’s correlation coefficient to determine correlation
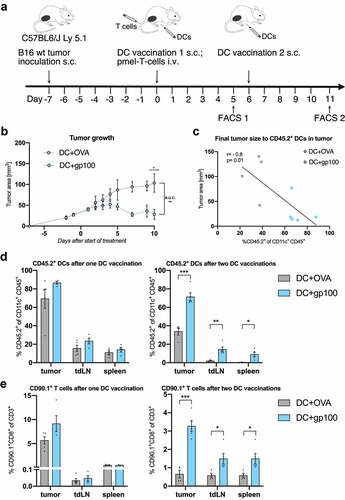
Figure 2. Arc/Arg3.1-dependent migration of injected TAA-loaded BMDCs to the tumor and secondary lymphoid organs following DC vaccination (n=4-5 per group). Flow cytometry analysis of injected CD45.2+ DCs eleven days after start of treatment. (A-C) Frequency of injected CD45.2+ DCs among all CD11c+ DCs in the tumor (A), tdLN (B) and the spleen (C). (D) Expression of DC activation markers MHCII and CD86 on tumor infiltrating CD45.2+. (E) Frequency of donor-derived CD45.2+ CD8a+ DCs among all CD11c+ DCs in the tumor and respective gating strategy for CD45.2+ CD8a+ DCs. All data are presented as mean SEM. We performed a one-way ANOVA in combination with Tukeys’s test to determine statistical significance (* p<0.05; ** p<0.01, *** p<0.001)
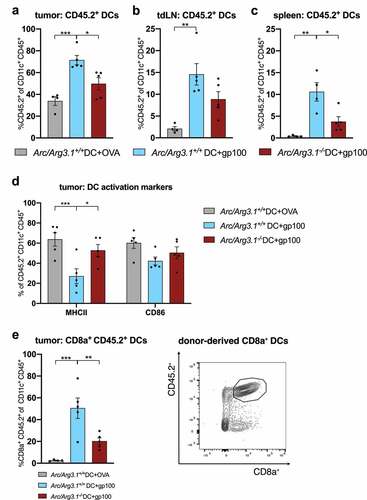
Figure 3. Recruitment of antigen-specific T cells to the tumor microenvironment depends on Arc/Arg3.1 expression in injected BMDCs. (A-B) In vivo bioluminescence imaging (IVIS) of adoptively transferred pmel luc mcherry T cells two to four days after start of treatment. (A) Photographic images of bioluminescence signals from luciferase expressing T cells in vivo in the tumor and at the DC vaccine injection site four days after start of treatment. (B) Quantification of bioluminescence signals from luciferase expressing T cells in the tumor and at the DC vaccine injection site measured from two days until four days after start of treatment. Signal is measured in photon/s and normalized to tumor size at respective days of measurements (n=3). (C) Flow cytometry analysis of frequency of CD90.1+CD8+ pmel T cells among all CD3+ T cells in the tumor, tdLN and the spleen eleven days after start of treatment (n=4-5 per group). All data are presented as mean SEM. For (B)-(C) we performed a one-way ANOVA in combination with Tukeys’s test to determine statistical significance (* p<0.05; ** p<0.01, *** p<0.001)
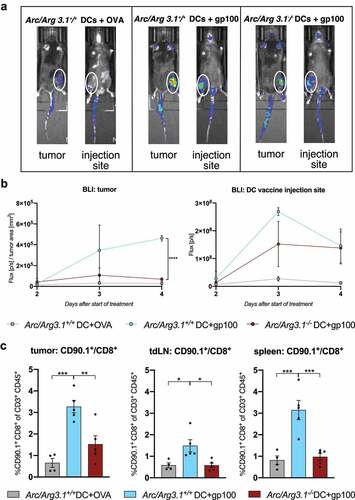
Figure 4. Retroviral transduction of BMDCs for the overexpression of Arc/Arg3.1. (A) Fluorescence microscopy of GFP and flow cytometry analysis of GFP+ cells after retroviral transduction with pMXS-Arc/Arg3.1-IRES-GFP (n=3). (B) Flow cytometry analysis of CD11c+ MHCII+ BMDCs among GFP+ cells after retroviral transduction with pMXS-Arc/Arg3.1-IRES-GFP (n=3). (C) Immunoblot of Arc/Arg3.1 from pMXS-control transduced, pMXS-Arc/Arg3.1 transduced and Arc/Arg3.1-/--BMDCs (n=3-4 per group). All data are presented as mean SEM. For (C) we performed a one-way ANOVA in combination with Tukeys’s test to determine statistical significance (* p<0.05; ** p<0.01)
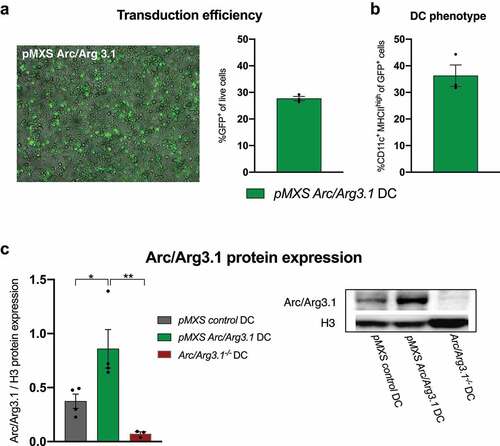
Figure 5. Arc/Arg3.1-overexpressing BMDCs in the tumor and secondary lymphoid organs following DC vaccination. Flow cytometry analysis of CD11c+ DCs in the tumor nine days after start of treatment. (A) Quantification of GFP signal (MFI) in flow cytometry on injected CD45.2+CD11c+ BMDCs and endogenous CD45.2-CD11c+ BMDCs in the tumor, tdLN and the spleen (n=11). (B) Correlation of donor derived CD45.2+CD11c+ DCs to MFI of GFP on CD45.2+ CD11c+ DCs in tdLN (n=11). All data are presented as mean SEM. For (A) we used a two-tailed student’s t test to determine statistical significance (* p<0.05; ** p<0.01, *** p<0.001, **** p<0.0001). For (B), Pearson’s correlation coefficient was calculated to determine correlation
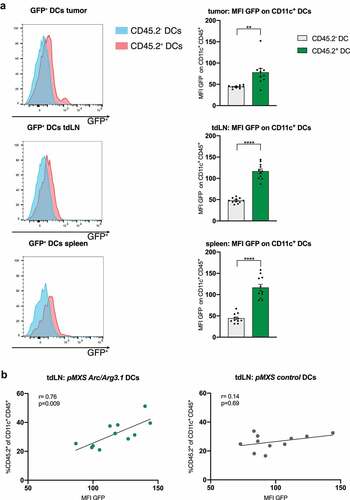
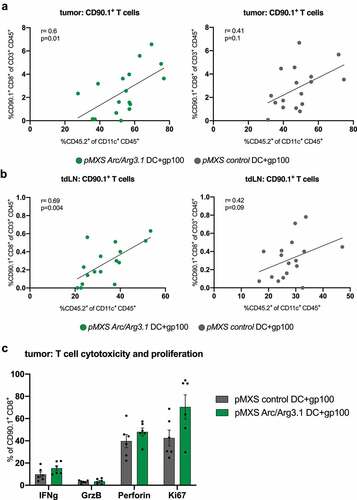
Figure 6. Antigen-specific T cells in the tumor microenvironment following vaccination with Arc/Arg3.1-overexpressing BMDCs. Flow cytometry analysis of CD45.2+CD11c+ DCs and CD90.1+CD8+ T cells in the tumor and tumor draining lymph nodes. (A)-(B) Correlation of CD90.1+CD8+ T cells to donor-derived CD45.2+CD11c+ DCs in the tumor (A) and tdLN (B) (n=17). (C) Expression of T cell activation and proliferation markers on tumor infiltrating CD90.1+CD8+ T cells. All data are presented as mean SEM. For (A) and (B) Pearson’s correlation coefficient was calculated to determine correlation