
Figures & data
Figure 1. Boxplots visualizing the density of CD8+ T cells, FoxP3 + T cells and CD20+ B cells in PT pre-NAC, PT post-NAC and LN post-NAC, in the entire cohort, esophageal and gastric tumors, respectively
Figure 2. Boxplots visualizing the expression of PD-L1IC and PDL1TC in PT pre-NAC, PT post-NAC and LN post-NAC, in the entire cohort, esophageal tumors and gastric tumors, respectively
Table 1. Intercorrelation between the investigated immune markers in the entire cohort
Figure 3. Boxplots visualizing the association between the density of CD8+ T cells, FoxP3 + T cells and CD20+ B cells in PT pre-NAC and PDL1IC and PDL1TC expression in PT pre-NAC and histopathological regression according to the different Chirieac categories (0%, 1–10%, 11–50% or >50% residual carcinoma) in the entire cohort
Table 2. Cox proportional hazards analysis of the impact of investigative lymphocyte subsets in PT pre-NAC, on time to recurrence and overall survival in the entire cohort
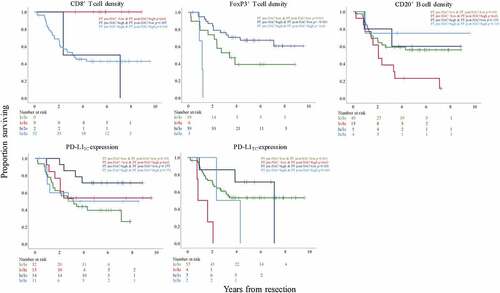
Figure 4. Kaplan-Meier estimates of TTR and OS in strata according to low and high total density of CD8+, FoxP3+, and CD20+ cells in PT pre-NAC in the entire cohort, defined by CRT analysis. Prognostic cutoff points based on CRT analyses for the different immune markers in PT pre-NAC, respectively, were as follows; high CD8+ >4.0%, high FoxP3+ >2.5%, high CD20+ >45.0%
Figure 5. Kaplan-Meier estimates of TTR and OS in strata according to low and high total density of CD8+, FoxP3+, and CD20+ cells in PT post-NAC in the entire cohort, defined by CRT analysis. Prognostic cutoff points based on CRT analyses for the different immune markers in PT post-NAC, respectively, were as follows; high CD8+ >1.3%, high FoxP3+ >5.3%, high CD20+ >15.8%
Table 3. Cox proportional hazards analysis of the impact of investigative lymphocyte subsets in PT post-NAC, on time to recurrence and overall survival in the entire cohort
Figure 6. Kaplan-Meier estimates of TTR and OS in strata according to low and high PD-L1IC and PD-L1TC expression, respectively, in PT pre-NAC and PT post-NAC, in the entire cohort, using the median value as cutoff. Prognostic cutoff points based on the median values were as follows; PT pre-NAC: high PD-L1IC >1%, high PD-L1TC > 0%. PT post-NAC: high PD-L1IC >0%, high PD-L1TC > 0%
Table 4. Cox proportional hazards analysis of the impact of PD-L1IC and PD-L1TC expression in PT pre-NAC and PT post-NAC, on time to recurrence and overall survival in the entire cohort
Figure 7. Kaplan-Meier estimates of OS in strata, in the entire cohort, with conversion-variables according to combinations of low or high CD8+, FoxP3+ and CD20+ cell density, respectively, in PT pre-NAC and PT post-NAC and low or high PD-L1IC and PD-L1TC expression, respectively, in PT pre-NAC and PT post-NAC. Prognostic cutoff points are defined by CRT analyses for CD8+, FoxP3+ and CD20+ cells and the median values for PD-L1IC and PD-L1TC expression
Supplemental Material
Download ()Availability of data and materials
Part of the data generated in this study is included in the article. The raw data of immune cell expression can be made available upon request. Patient and clinicopathological data cannot be made publicly available due to their content of identifiable human data. Requests to access the datasets should be directed to the corresponding author.