
Figures & data
Figure 1. Expression profile of Cldn-7 in inflamed mucosa of IBD patients and DSS-induced colitis mouse model. (a) Representative intestinal sections were prepared from colonic tissues of healthy control and inflamed mucosa of IBD patients, and stained for Cldn-7 by immunohistochemistry. Right: Quantification of the average intensity of Cldn-7 per high power field (HPF) (****p < .0001, n = 8). (b) 5%DSS was administered in drinking water for 7 days. Changes in body weights were shown as percentage of initial weights at the start of the experiments (****p < .0001, n = 5). (c) Gross morphology and length (from appendix to anus) of colon tissues at the end of the experiment (***p < .001, n = 5). (d) Representative images of H&E-stained colonic tissues and expression of Cldn-7 by IHC (n = 5). (e) Representative immunoblot images of Cldn-7 from colonic lysates at the end of DSS treatment (upper panel). Lower panel: quantitative expression of Cldn-7 (*p < .05, n = 5). All images were visualized using Nikon Eclipse E200 microscope and analyzed by Image J software. Scale bars: 50 µm
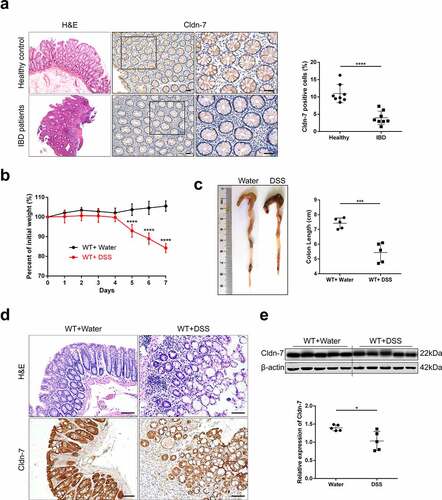
Figure 2. Increased susceptibility of Cldn-7 knockout mice to DSS-induced colitis. (a) Western blot experiments were performed in tissues from CreERT2 and CreW mice. (b) Relative mRNA expression level of Cldn-7 in colonic epithelia (****p < .0001). (c) Schematic protocol used to induce colitis. CreW and CreERT2 mice were fed 3%DSS or tap water for 7 days. (d) Kaplan-Meier survival plots described colitis-induced animal mortality (CreERT2+DSS vs CreW+DSS, p < .0001). (e) Changes in body weights were measured as percentage of the initial weight at the start of the experiments (CreERT2+DSS vs CreW+DSS, **p < .01, ***p < .001, ****p < .0001, n = 6). (f) Gross morphology and length of colon from mice either untreated or treated with DSS for 7 days (**p < .01, ****p < .0001, n = 10). (g) Representative photograph of rectal bleeding from the mice treated with DSS. (h) Spleen weights (*p < .05, n = 4). (i) Daily recorded DAI score (CreERT2+DSS vs CreW+DSS, *p < .05, **p < .01, ****p < .0001, n = 6). (j) Representative H&E-stained colon sections and colonic pathological scores for inflammation, extent of injury, crypt damage and regeneration (*p < .05, ***p < .001, n = 8). Images were acquired with Nikon Eclipse 80i microscope. Scale bars: 50 µm
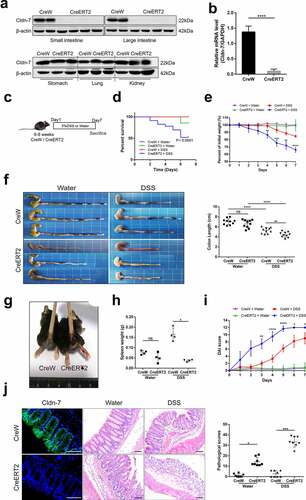
Figure 3. Loss of Cldn-7 increases colonic infiltration of leukocytes during experimental colitis. (a) Changes of hematological parameters in mice after induction of experimental colitis (n = 3–4). (b) Quantification of leukocytes (CreERT2+DSS vs CreW+DSS, ****p < .0001, n = 3–4). (c) Neutrophils, Macrophages, T cells and B cells were visualized by immunolabeling specific cellular markers, Ly-6B.2 (red), F4-80 (red), CD4 (green) and CD45R (red), correspondingly. DAPI was used to visualize nucleus (blue). Quantification of positive area was shown in the lower panels (n = 3). Scale bars: 25 µm. The symbols *, **, *** and **** indicate p < .05, p < .01, p < .001 and p < .0001, respectively. Images were acquired with Nikon Eclipse 80i microscope and analyzed by Image J software
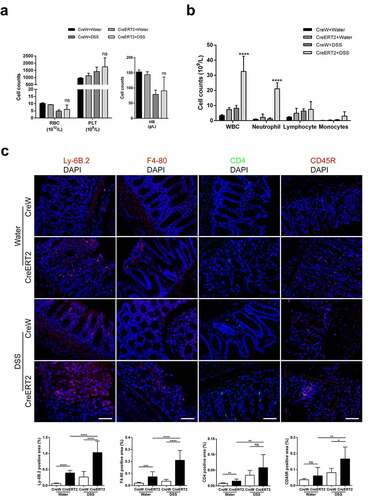
Figure 4. Cldn-7 deficiency dysregulates cytokine and chemokine expression. (a) Total RNA was extracted from colonic tissues, relative mRNA expression levels of inflammatory cytokines in colonic epithelia were determined by qRT-PCR, including IL-6, IL-1β, TNF-α, IL-17, IL-10, TGF-β, and chemokine CXCL-1, CCL-5 (*p < .05, **p < .01, ****p < .0001, n = 3–4). (b) Heat map indicating the cytokines expression profiles. Each row represents expression profile of a tissue sample, and each column corresponds to a change in protein level. The color scale from blue to red indicates z score. (c) Cytokines were quantified with Quantibody® Mouse TH17 Cytokine Array 1. The results were analyzed using RayBio Analysis Tool Excel sheet (*p < .05, n = 4–6)
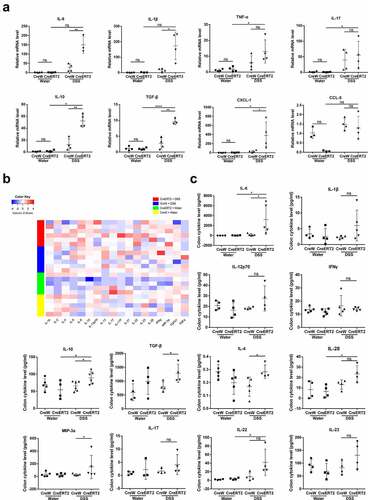
Figure 5. Deletion of Cldn-7 affects intestinal homeostasis and exacerbates intestinal barrier function. (a) Epithelial cell proliferation was assessed by immunostaining of Ki-67. Right: Ki-67-positive cells were quantified in at least five HPFs per mouse. Scale bars: 25 µm (*p < .05, ***p < .001, n = 3). (b) The number of apoptotic cells was visualized using TUNEL assay (green). Nuclear counter-staining (blue) was used to visualize the position of an individual cell. Scale bars: 50 µm. Right: Percentage of apoptotic cells per HPF was averaged in each group (*p < .05, **p < .01, n = 4). Images were acquired with Nikon Eclipse 80i fluorescence microscope and analyzed by Image J software. (c) Representative electron microscope images identified tight junctions and intercellular spaces of colonic epithelium. Black arrows label tight junctions and arrowheads delineate intercellular spaces on the basolateral side. Scale bars: 500 nm. (d) Intestinal permeability was determined by measuring transmucosal flux of FITC-dextran in blood serum after four hours of gavage with FITC-dextran (*p < .05, n = 4)
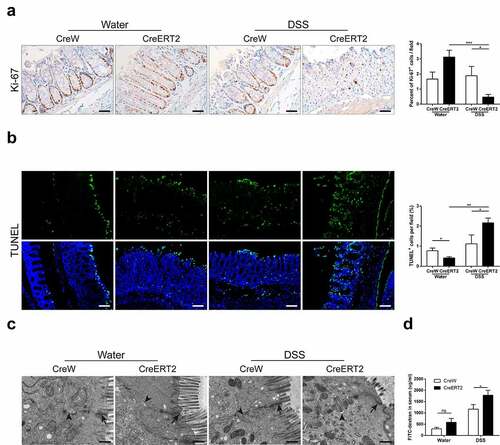
Figure 6. Susceptibility to carcinogenesis is enhanced in Cldn-7-deficient mice in the AOM/DSS-induced colitis-associated colorectal model. (a) Schematic representation of AOM/DSS treatment to induce CAC. (b) Changes of body weight curve in AOM/DSS induction period. (c) Representative images of gross morphology and anal fistula at the end point of 120 days. (d) Survival analysis at the end of the experiment. (e) Representative views of colons, lengths and weights of colons at day 120 after AOM injection (*p < .05, ****p < .0001, n = 6–10). (f) Spleen weights (*p < .05, n = 10). (g) Representative images of colon tumors in AOM/DSS-induced mice. The number of lesions in the entire colon per mouse was counted, and the size of each lesion was measured (*p < .05, n = 10). (h) Images of H&E-stained colon sections demonstrated histologic features of tumors in CreW and CreERT2 mice (Scale bars: 50 µm). Right: Tumors were classified into low or high grade based on histological analysis. Images were visualized using Nikon Eclipse E200 microscope
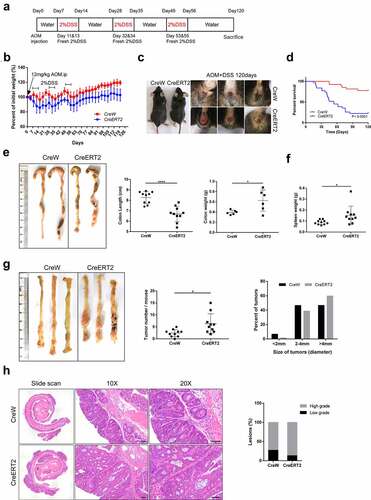
Figure 7. Loss of Cldn-7 activates Wnt/β-catenin signaling pathway. (a) Paracancerous tissues and tumor sections were stained for Ki-67 on day 70 and 120, respectively, during experimental procedure. Right: Quantification of positive Ki-67 area per field (*p < .05, **p < .01, ****p < .0001, n = 5). (b) Representative immunohistochemical images of Cldn-7, β-catenin, c-Myc and Cyclin D1 in cancer tissues and adjacent noncancerous tissues from CreW and CreERT2 mice at the end point of 120 days. Lower panels: Percentage of positive cells was analyzed using ImageJ software (*p < .05, **p < .01, ***p < .001, n = 3). Scale bars: 50 µm. All images were visualized using Nikon Eclipse E200 microscope and analyzed by Image J software
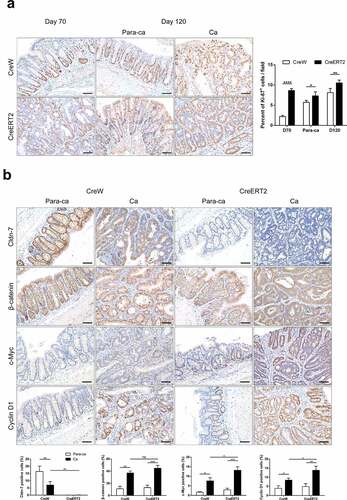
Figure 8. Inhibition of Cldn-7 disrupts biological function and aggravates inflammatory injury in DSS induced cytotoxicity. (a-b) Transfection of Caco-2 cells with specific shRNA. Efficiency of knockdown was confirmed by WB and qRT-PCR (**p < .01). (c) The effect of DSS at different concentrations (5%, 8%, 10%, respectively) on cell viability was estimated by CCK-8 assay (**p < .01, ****p < .0001). (d) Potential effect of DSS on cell apoptosis was determined by Annexin V-PE/7-AAD staining assay (left panels). Quantification of the number of apoptotic cells was performed (right panel, * p < .05). (e) The effect of Cldn-7 knockdown on cell apoptosis. (f) The effect of Cldn-7 knockdown on DSS-induced cell viability (*p < .05, ****p < .0001). (g) The mRNA levels of cytokines in DSS-stimulated injury of epithelial cells were analyzed by qRT-PCR (*p < .05, **p < .01, ****p < .0001). (h) Effects of Cldn-7 on intestinal permeability in Caco-2 cells. After cells grew into a monolayer, FITC-dextran was added to the upper chamber, and individual concentration of FITC-dextran in the lower chamber was detected at 0.5 h, 1 h, 2 h and 3 h, respectively (*p < .05, **p < .01). (i) Representative electron microscope images described potential effects of Cldn-7 on tight junctions and intercellular spaces of Caco-2 cells. Scale bars: 5 μm. For all experiments, data are representative of at least three independent experiments
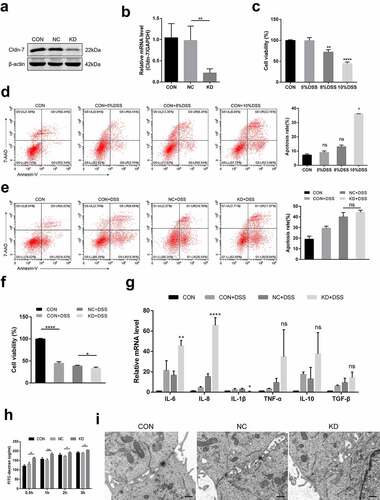
Figure 9. Working model of the role of Cldn-7 in regulating intestinal homeostasis and colitis-associated carcinogenesis
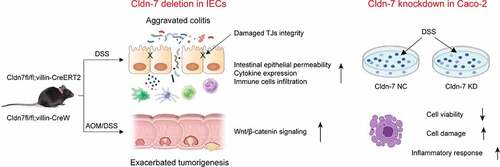
Table 1. Antibody information used in this experiment
Table 2. Primer sequences used for the qRT-PCR assays