Figures & data
Table 1. Correlations of investigated biomarkers with PAM50 subtypes (n = 232)
Table 2. Prognostic hazard ratios in the overall cohort for high vs low levels of immune biomarkers in univariate analysis
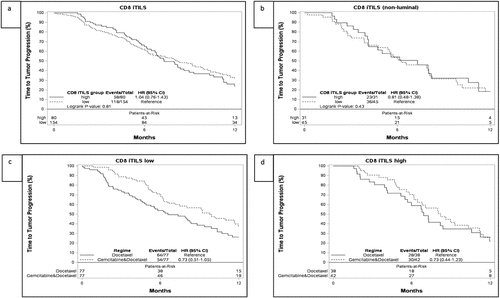
Figure 1. Time to progression (TTP) and associations with CD8 levels in the SBG0102 trial population. A. CD8 iTILs and TTP in the overall cohort, B. CD8 iTILs and TTP in the non-luminal (BL and HER2E) subtypes C. TTP for the CD8 iTILs low group, stratified by treatment with docetaxel or docetaxel + gemcitabine (DG) D. TTP for the CD8 iTILs high group, stratified by treatment with docetaxel or DG. Corresponding figures for overall survival can be seen in Supplementary Figure S3. iTILs: intratumoral tumor infiltrating lymphocytes

Table 3. Predictive hazard ratios for treatment effect for TTP in patients treated with docetaxel + gemcitabine vs docetaxel alone. Values shown for multivariate analysis for the whole subset, and for the focused set of analyses performed on the non-luminal subset a Basal like + HER2E
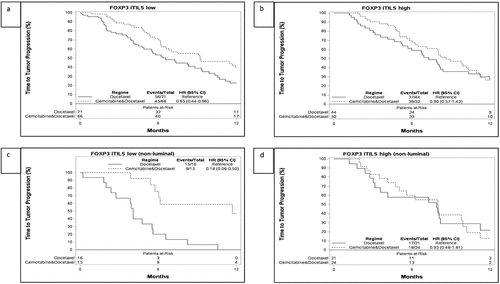
Figure 2. Time to progression (TTP) and associations with FOXP-3 iTILs levels and treatment arm in the SBG0102 trial population (A+B) and in the nonluminal subtypes (C+D). A. TTP for the FOXP3 iTILs low group, stratified by treatment with docetaxel or docetaxel + gemcitabine (DG), B. TTP for the FOXP3 iTILs high group, stratified by treatment with docetaxel or docetaxel + gemcitabine, C. TTP for the FOXP3 iTILs low non-luminal group, stratified by treatment with docetaxel or docetaxel + gemcitabine. D. TTP for the FOXP3 iTILs high non-luminal group, stratified by treatment with docetaxel or DG. Corresponding figures for overall survival can be seen in Supplementary Figure S4. iTILs: intratumoral tumor infiltrating lymphocytes

