Figures & data
Table 1. List of peptides expressed by minigenes
Table 2. List of peptides checked for CTL induction
Figure 1. ELISPOT assay showed the IFNγ secretion of expanded TILs induced by CIR A02:01 cells loaded with in vitro transcribed RNA. TILs derived from patient B2 or B8 were co-cultured with neoantigens-pulsed CIR A02:01 for ten days, and IFNγ secretions of which were detected by ELISPOT. Non-pulsed (NP) control result of B8 was shown as A1-A3; the result of minigene B8-1 pulsed C1R A02:01 cells as A4-A6; B8-2 as B1-B3; B8-3 as B4-B6; B2-1 as C1-C3; B2-2 as C4-C6; non-pulsed of B2 as D1-D3; B2-3 as D4-D6; positive controls of B8 and B2, which were treated with PMA and Ionomycin, were presented as F1-F3 and F4-F6, respectively. Experiments were conducted in triplicate. TNTC represents too numerous to count
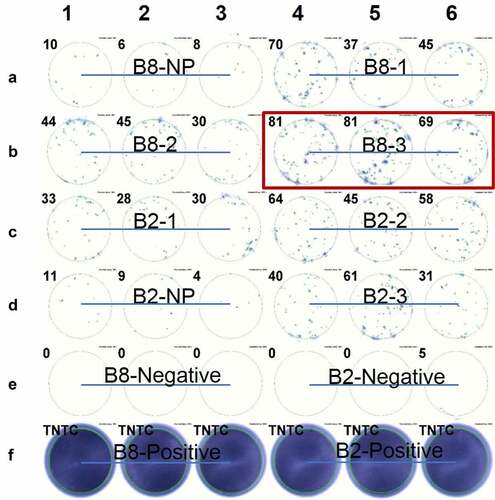
Figure 2. Induction of neoantigen-specific CTLs and identification of TCRA and TCRB sequences of sorted CD8+/tetramer+ T cells. (a) Peptide-HLA Tetramer assay for TILs co-cultured with C1R A02:01 pulsed with or without KIAA1429D1358E peptide (left); the pie-chart showed the frequencies of TCRA, TCRB and CDR3 sequences of sorted CD8+/tetramer+ T cells (right). Antigen peptide of CMV pp65 for HLA-A02:01 was used as a positive control. (b) Peptide-HLA Tetramer assay for TILs co-cultured with C1R A02:01 pulsed with or without MAPK13G137V peptide (left); the pie-chart showed the frequencies of TCRA, TCRB and CDR3 sequences of sorted CD8+/tetramer+ T cells (right). Antigen peptide of CMV pp65 for HLA-A02:01 was used as a positive control
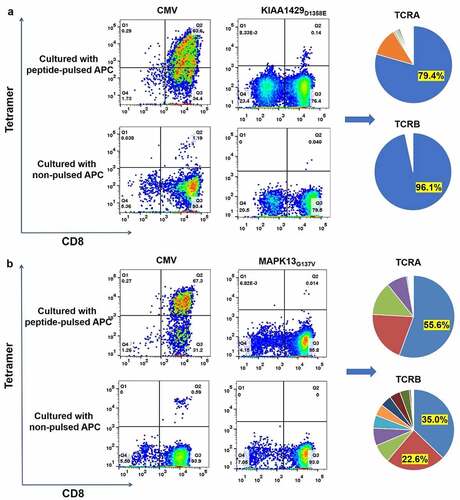
Figure 3. Construction of KIAA1429D1358E- TCR-engineered T cells. (a) The proportion of T cells expressing KIAA1429D1358E specific TCR were stained with human CD8 antibody and an antibody against the mouse constant region of TCRβ. (b) KIAA1429D1358E- TCR-engineered T cells were stained with an HLA-Tetramer loaded with the corresponding wild-type or mutated peptide
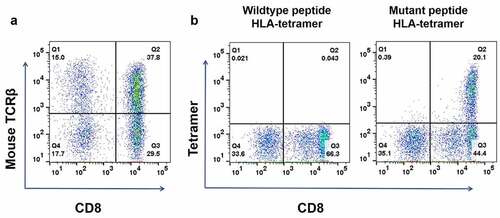
Figure 4. Functional analysis of KIAA1429D1358E- TCR-engineered T cells. (a) IFNγ ELISPOT assay of KIAA1429D1358E- TCR-engineered T cells stimulated by C1R A02:01 cells pulsed with different concentrations of mutated or wild-type peptide. (b) IFNγ ELISA assay of KIAA1429D1358E- TCR-engineered T cells stimulated by C1R A02:01 cells loaded with different concentrations of the mutated or wild-type peptide. (c) IL-2 ELISA assay of KIAA1429D1358E- TCR-engineered T cells stimulated by C1R A02:01 cells loaded with different concentrations of the mutated or wild-type peptide. (d) TNF-α ELISA assay of KIAA1429D1358E- TCR-engineered T cells stimulated by C1R A02:01 cells loaded with different concentrations of the mutated or wild-type peptide. (e) CD137 staining of KIAA1429D1358E- TCR-engineered T cells stimulated by C1R A02:01 cells loaded with different concentrations of the mutated or wild-type peptide. (f) Cytotoxic activity of KIAA1429D1358E- TCR-engineered T cells under different effector cell/target cell ratios. Four different ratios (2:1, 5:1, 10:1 and 20:1) were examined. The asterisks indicate the statistically significant difference (p < .05) between two groups
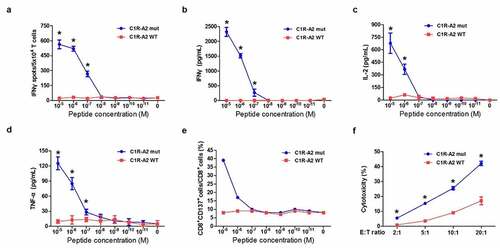
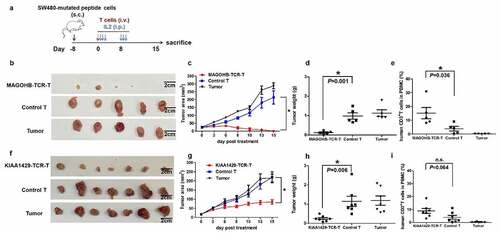
Figure 5. Evaluation of the in vivo activities of MAGOHBG17A- TCR-engineered T cells and KIAA1429D1358E- TCR-engineered T cells. (a) NCG mice were burdened with subcutaneous tumors carrying MAGOHBG17A mutation or KIAA1429D1358E mutation for eight days, and treated with intravenous injections of corresponding TCR-engineered T cells, respectively. 400,000 IU systemic IL-2 was given daily by intraperitoneal injection for 3 days. For mice treated with MAGOHBG17A- TCR-engineered T cells: (b) tumor sizes, (c) tumor area of tumor growth over time, (d) tumor weights and (e) proportions of human CD3+ T cell in the peripheral blood at the end of this experiment were recorded. For mice treated with KIAA1429D1358E- TCR-engineered T cells: (f) tumor sizes, (g) tumor area of tumor growth over time, (h) tumor weights and (i) proportions of human CD3+ T cell in the peripheral blood at the end of this experiment were recorded