Figures & data
Figure 1. Overview of the data and the DIMEimmune method. a. Data sources and number of samples; b. Overview of the method: the final lymphocyte-specific signature is the intersection of three sets of CpGs. The first two sets are obtained within the framework of differential methylation analysis and the third one by threshold analysis. The first group is selected based on the difference between brain tumor samples, and CD4+ and CD8+ T cells by applying an unpaired t-test. The second group is selected by applying a paired t-test on different immune cell types in the blood. Additionally, a threshold analysis is conducted, which gives the third group of CpGs. The final estimate for lymphocyte infiltration is obtained from dimensionality reduction using PCA; c. Validation: Methylation-based estimates are obtained by applying the learned rotation matrix of PCA on the validation data. Gene expression-based estimates are computed from specific signatures as previously described.Citation8 Both methods are compared on the same samples using RNAseq/gene expression and methylation-based values in the form of correlation and scatter diagrams
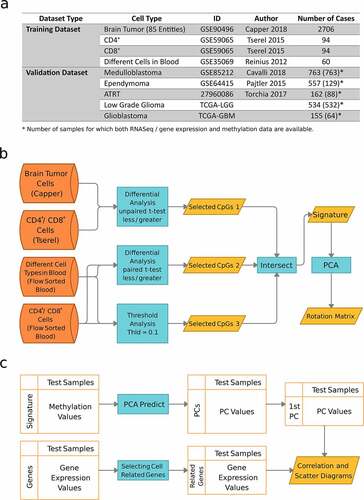
Figure 2. Visualization of the DIMEimmune signatures using heatmaps. Each colorful dot represents the methylation value of the corresponding CpG in the specified sample; a. DIME-TIL signature for tumor-infiltrating lymphocytes; b. DIME-CD4 signature of CD4+ T cells; c. DIME-CD8 signature for CD8+ T cells. d. Overview comparing estimates based on the three aforementioned signatures and MeTIL on the flow-sorted blood dataset. The DNA methylation values of samples of the same type have been averaged
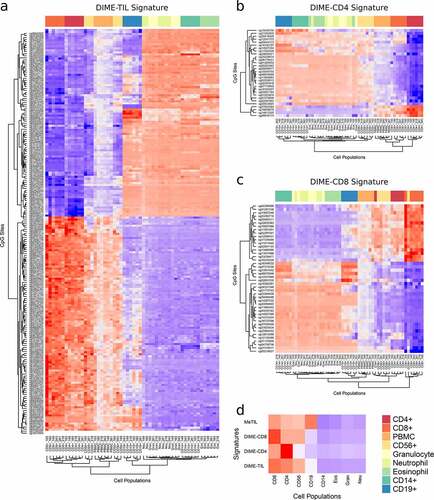
Table 1. Enrichment analysis of immune signatures. Results are tabulated for: DIME-TIL signature of tumor-infiltrating lymphocytes; DIME-CD4 signature of CD4+ T cells; DIME-CD8 signature of CD8+ T cells
Figure 3. Immunohistological validation of methylation-based TIL estimates. Parallel immunohistological analyses for CD3 as well as methylation analyses were performed in a cohort of 47 brain tumors. Examples of tumors with low/absent CD3+ cells; a. anaplastic astrocytoma IDH-mutant, WHO grade III, intermediate CD3+ cells; b. rosette forming glioneuronal tumor, WHO grade I, and high numbers of CD3+ cells; c. glioblastoma IDH wild-type, WHO grade IV. Immunohistological counts of CD3+ cells are compared to DIME-TIL (d), MeTIL (e) and the sum of the T cells signatures analyzed by MethylCIBERSORT (f)
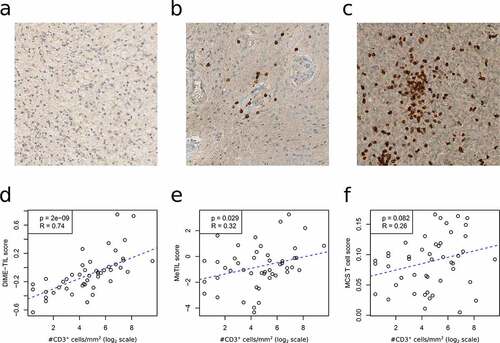
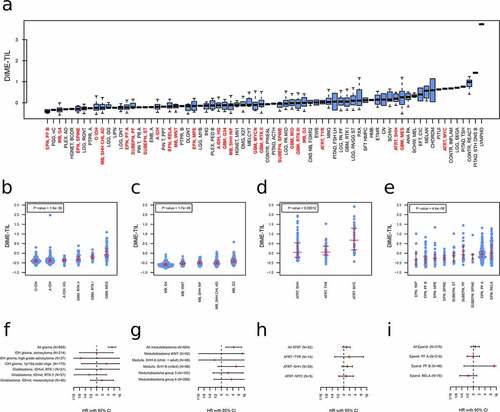
Figure 4. Comparison of DIMEimmune with previous studies for different tumor types (GBM, LGG, MB, ATRT, and EPN). Here, the gene expression/RNAseq-based results are used as the benchmark. In the diagrams, the dots are the samples, for which both gene expression/RNAseq and methylation data are available. The y-axis represents the gene expression/RNAseq-based estimates and the x-axis contains the methylation-based estimates; a. Comparison of DIME-TIL and MeTIL with gene expression/RNAseq-based estimation of T cells; b. Comparison of DIME-CD4 and CD4+ T cells estimates obtained from MethylCIBERSORT (MCS) with gene expression/RNAseq-based estimation of CD4+ T cells; c. Comparison of DIME-CD8 and CD8+ T cells estimates obtained from MethylCIBERSORT with gene expression/RNAseq-based estimation of CD8+ T cells
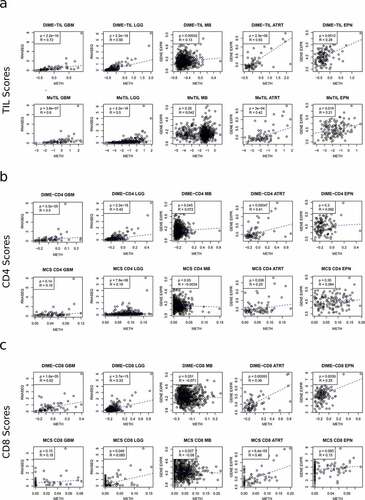
Figure 5. Clinical application of immune cell estimation. The estimated score of tumor-infiltrating lymphocytes for different subgroups of the Capper et al. validation data set (a), the TCGA glioma samples (b), medulloblastoma samples (c), ATRT (d), and ependymoma samples (e). The p-values are calculated based on the Kruskal-Wallis test. f-i.: Survival analysis for the prognostic relevance of DIME-TIL estimates for the same data as in panel b-e in the form of forest plots. HR: hazard ratio, CI: confidence interval