Figures & data
Figure 1. Schematic diagram of the study design
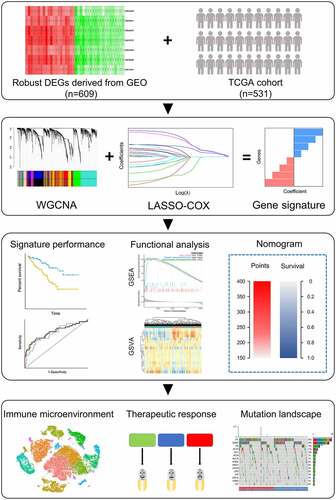
Figure 2. Identification of the key module by WGCNA. (a) Clustering dendrogram of ccRCC samples and heatmap of clinical traits. The clustering was based on the expression data of robust DEGs. The color intensity in heatmap increased with age, pathological stage and grade. In terms of survival status, white means alive and red means dead. (b) Analysis of the scale-free fit index (left) and the mean connectivity (right) for various soft-thresholding power value. (c) Clustering of module eigengenes. The red line indicates cut height = 0.20. (d) Dendrogram of all DEGs clustered based on a dissimilarity measure (1-TOM) together with assigned module colors. (e) Heatmap of the correlation between module eigengenes and clinical traits of ccRCC. Each cell contains the Pearson correlation coefficient and P value. (f) Distribution of average gene significance and errors in the modules associated with survival status of ccRCC
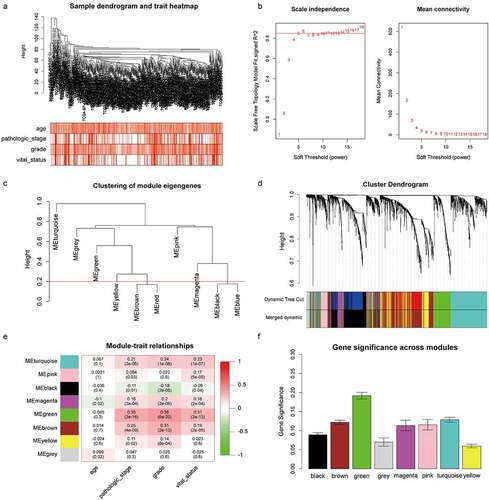
Table 1. Clinical and pathologic features of 348 ccRCC patients in TMA cohort
Figure 3. Construction of the gene signature. (a) 10-time cross validation for tuning parameter selection by LASSO regression. The solid vertical lines are partial likelihood deviance ± standard error (SE). The dotted vertical lines are drawn at the optimal values by minimum criteria and 1-SE criteria (b) Expression levels of 4 selected genes between tumors and peritumor tissues in TCGA database (c) Representative immunostaining pictures of 4 selected genes. Staining of FOXM1, TOP2A and KIF18B are mainly located in the nuclei as well as cytoplasm, staining of NUF2 are mainly located in the cytoplasm. The upper half comprises images of tumors, images of adjacent normal tissues were at the bottom half. Scale bar: 100 μm. (d) Expression levels of 4 selected genes between tumors and peritumor tissues in the TMA cohort. (e) Kaplan–Meier survival analysis of 4 selected genes in the TMA cohort. ***P < .001
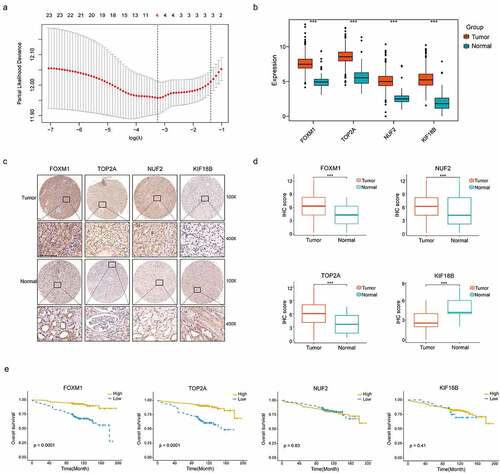
Figure 4. Distribution of risk score, Kaplan–Meier survival analysis, time-dependent ROC curves at 3, 5, and 8 years between patients at high- and low-risk in TCGA discovery set (a), TCGA validation set (b), E-MTAB-1980 (c) and TMA cohort (d)
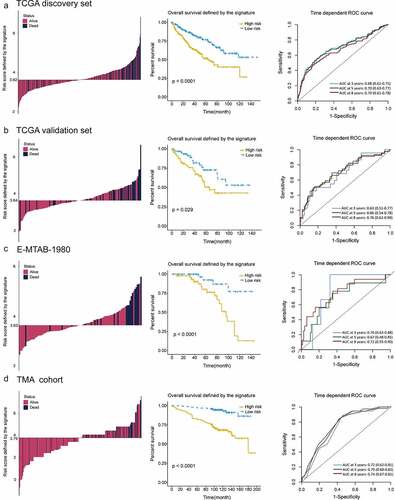
Figure 5. High correlations of the gene signature with tumor grade and pathologic stage followed by functional analysis of signature genes. (a) Distribution of G1&G2 and G3&G4 tumors between high- and low-risk group in TCGA, combined GEO (GSE66272 & GSE36895), E-MTAB-1980 and TMA cohort. (b) Distribution of stage I/II and III/IV tumors between high- and low-risk group in TCGA, combined GEO (GSE66272 & GSE36895), E-MTAB-1980 and TMA cohort. (c) Representative immunostaining pictures of FOXM1 and TOP2A between different tumor grade. Scale bar: 100 μm. Top 3 gene sets enriched in the high-expression group of signature genes (d) FOXM1 (e) TOP2A. Clustering heatmaps of differentially enriched pathways for signature genes based on GSVA. (f) FOXM1 (g) TOP2A. χ2 test was used to test difference in distribution of tumor grade and pathologic stage, *P < .05.**P < .01.***P < .001
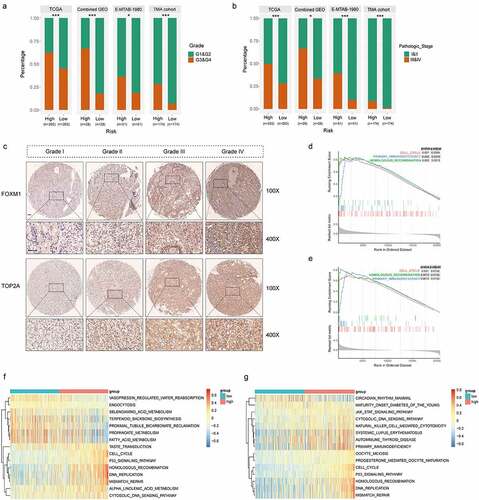
Table 2. Association of TOP2A and FOXM1 expression with clinicopathologic factors of ccRCC patients in TMA cohort
Figure 6. Immunosuppressive phenotype exists in high-risk tumors. (a) Results of ESTIMATE score and differentially infiltrated immune cells evaluated by CIBERSORT and IMMUNECELL AI between high- and low-risk group in TCGA. (b) Relative cell abundance of Macrophage and Treg calculated by CIBERSORT and IMMUNECELL AI between two groups in TCGA. (c) Cell percentage of CD68+ Macrophage, CD68+ CD163+ Macrophage M2, FOXP3+ Treg and PD-L1 expression in tumors detected by mIHC in the TMA cohort. (d) Representative immunofluorescence staining pictures of high- and low-risk tumors. DAPI (blue), CD68 (purple), CD163 (red), FOXP3 (green). (e) Differentially expressed genes profile involved in the negative regulation of the Cancer-Immunity Cycle between high- and low-risk group. (f) Expression of the common immune checkpoints between high- and low-risk group. (g) Expression of the immune suppressive cytokines between high- and low-risk group. *P < .05.**P < .01.***P < .001
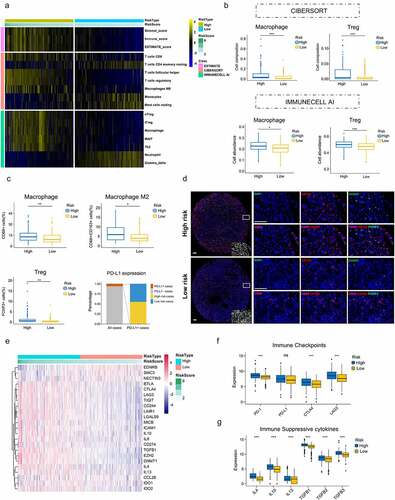
Figure 7. Increased response to anti-PD-1 immunotherapy exists in low-risk tumors. (a) Risk group and response to anti-PD-1 therapy by sample. (b) Proportion of low-risk tumors in CB versus NCB group. Error bars are standard errors, which were calculated as follows: p(1 − p)/n, where p is the proportion in the population and n is the sample size. (c) PFS in high- and low-risk patients with advanced ccRCC. (d) PD-L1 expression between CB and NCB group (e) Proportion of PBRM1 LOF tumors in CB versus NCB group (f) Tumor mutation burden between CB and NCB group. χ2 test and independent t-test were used for statistical analysis
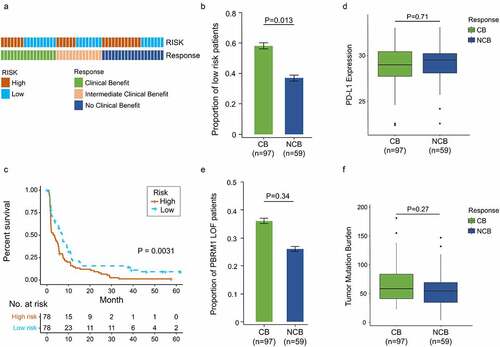
Figure 8. Somatic variants between high- and low-risk tumors in TCGA. Top 15 gene mutations in high-risk (a) and low-risk tumors (b). (c) Top 5 differentially mutated genes between high- and low-risk tumors. (d) Proportion of PBRM1 LOF in high- and low-risk tumors. (e) OS of ccRCC patients with PBRM1 LOF and PBRM1 intact. (f) Multivariate analysis of the gene signature and mutation status of PBRM1 (g) OS of ccRCC patients sorted by combined score: PBRM1 LOF and low-risk, 1; PBRM1 LOF and high-risk, PBRM1 intact and low-risk, 2; PBRM1 intact and high-risk, 3. χ2 test was used to test difference in proportions of gene mutation
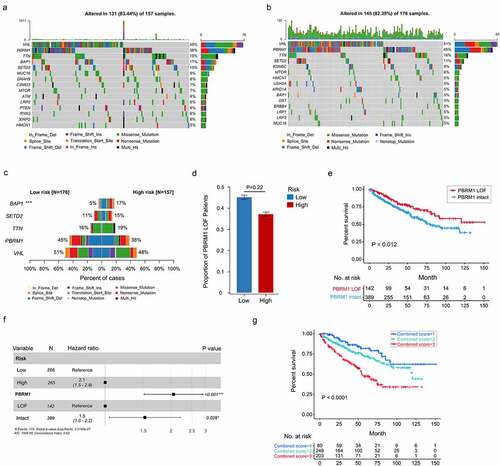
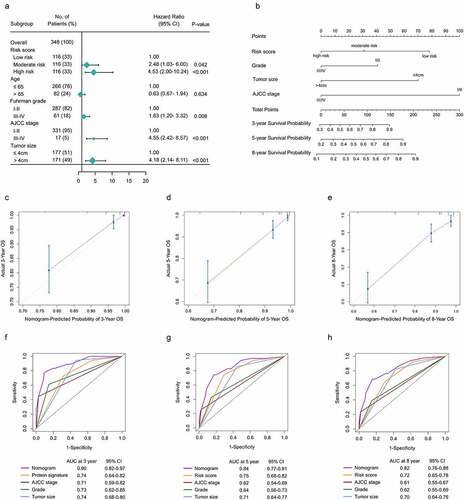
Figure 9. Construction f a nomogram predicting OS based on the gene signature in ccRCC. (a) Multivariate analysis in the TMA. (b) Nomogram integrated the gene signature, AJCC stage, grade and tumor size (c-e) Calibration curve for predicting OS at 3, 5 and 8 years. (f-h) Time dependent ROC curves of nomogram, cell cycle-related signature, AJCC stage, grade and tumor size at 3, 5 and 8 years