
Figures & data
Figure 1. KLRG1 knockout mice display fewer B16-E-cadherin tumors in the lungs
(A) Flow cytometry profile of B16-F10 melanoma and B16-E-cadherin melanoma stained with an anti-E-cadherin mAb or KLRG1 tetramer. (B) KLRG1+/+ mice were intravenously injected with 2 × 10⁴ B16-F10 cells or 2 × 10⁴ B16-E-cadherin cells. Day 21 post-injection, the presence or absence of at least one tumor was examined macroscopically (n = 18). (C) KLRG1+/+ and KLRG1−/- mice were intravenously injected with 2 × 10⁵ B16-F10 cells/mouse. Total tumor number in the lungs was quantified at day 21 post-injection (n = 13–14). (D) KLRG1+/+ and KLRG1−/- mice were intravenously injected with 2 × 10⁵ B16-E-cadherin cells/mouse. Left panel: Representative images of lungs from KLRG1+/+ untreated, KLRG1+/+ treated and KLRG1−/- treated mice. Right panel: Total tumor number in the lungs was quantified at day 21 post-injection (n = 14). (Data are representative of (A, D) or pooled from two experiments (B-D), error bars indicate S.E.M.) *p < .05, **p < .01, ***p < .001, and ****p < .0001.
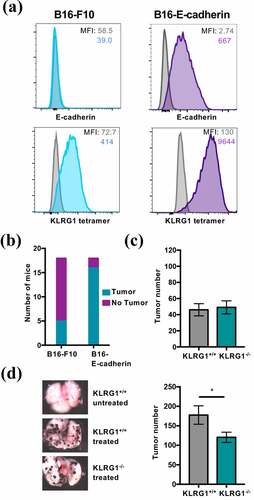
Figure 2. Combination KLRG1 and PD-1 therapy synergizes to decrease B16-E-cadherin tumor burden
(A) Flow cytometry profile of B16-F10 melanoma or B16-E-cadherin melanoma stained with an anti-PD-L1 mAb. (B) C57BL/6 mice were subcutaneously injected with 2 × 10⁵ B16-E-cadherin cells. Tumor-bearing mice were treated with isotype control, anti-KLRG1 mAb, anti-PD-1 mAb or anti-KLRG1 + anti-PD-1 mAbs on day 7, 10, 13, and 16 post-tumor cell implantation. Tumor volume was measured via caliper every three days (n = 8–13). (C) Flow cytometry characterization of tumor infiltrating NK and CD8+ T cells from isotype control treated mice day 22 post-tumor implantation. Spleen was used as control. Upper panel: representative staining profiles of KLRG1 and PD-1 expression on tumor infiltrating NK and CD8+ T cells. Lower panel: Pie chart analysis of KLRG1 and PD-1 expression (mean ± SD) (n = 8–13). (Data are representative of (A, C) or pooled from two experiments (B, C), error bars indicate S.E.M.) *p < .05, **p < .01, ***p < .001, and ****p < .0001.
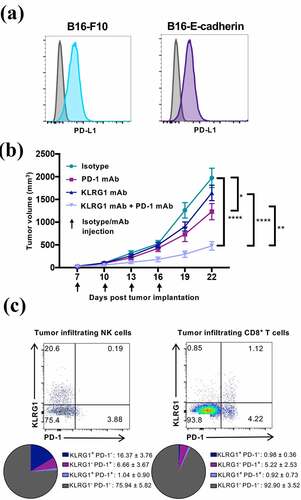
Figure 3. Combination therapy increases NK cell and CD8+ T cell frequency in the tumor microenvironment
(A) Frequency of NK cells and CD8+ T cells in the spleen and within the tumor of B16-E-cadherin tumor-bearing mice on day 22 post-tumor cell implantation (n = 8–13). (B) Frequency of CD69+ NK and CD69+ CD8+ T cells in the tumor of B16-E-cadherin tumor-bearing mice on day 22 post-tumor cell implantation (n = 8–13). (C) Frequency of indicated NK cell maturation markers on tumor infiltrating NK cells day 22 post-tumor cell implantation (n = 8–13). (Data are pooled from two experiments (A-C), error bars indicate S.E.M.) *p < .05, **p < .01, ***p < .001, and ****p < .0001.
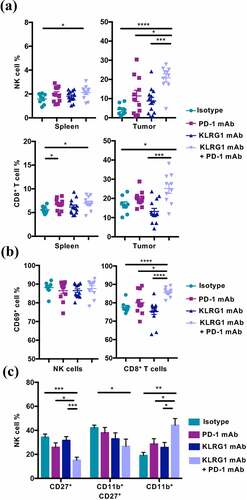
Figure 4. Combination KLRG1 and PD-1 therapy synergizes to decrease B16-F10 tumor growth
(A) C57BL/6 mice were subcutaneously injected with 2 × 10⁵ B16-F10 cells. Tumor-bearing mice were treated with isotype control, anti-KLRG1 mAb, anti-PD-1 mAb or anti-KLRG1 + anti-PD-1 mAbs on day 7, 10, 13, and 16 post-tumor cell implantation. Tumor volume was measured via caliper every three days (n = 8–13). (B) Frequency of NK cells and CD8+ T cells in the spleen and tumor of B16-F10 tumor-bearing mice on day 22 post-tumor cell implantation (n = 8–13). (C) Frequency of indicated NK cell maturation markers on tumor infiltrating NK cells day 22 post-tumor cell implantation (n = 8–13). (Data are pooled from two experiments (A-C), error bars indicate S.E.M.) *p < .05, **p < .01, ***p < .001, and ****p < .0001.
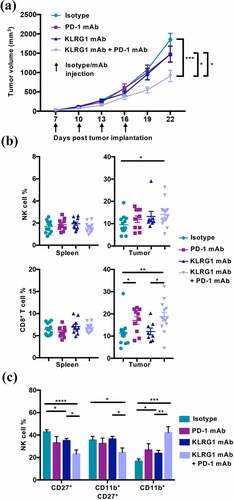
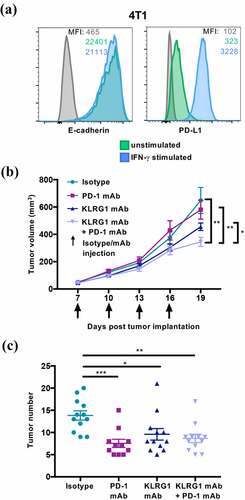
Figure 5. KLRG1 therapy alone decreases 4T1 tumor burden in the lungs while double blockade therapy decreases subcutaneous 4T1 tumor burden
(A) Flow cytometry profile of 4T1 mammary carcinoma, unstimulated or treated with IFN-γ, and stained with an anti-E-cadherin mAb or an anti-PD-L1 mAb. (B) Balb/c mice were subcutaneously injected with 1 × 10⁵ 4T1 cells. Tumor-bearing mice were treated with isotype control, anti-KLRG1 mAb, anti-PD-1 mAb or anti-KLRG1 + anti-PD-1 mAbs on day 7, 10, 13, and 16 post-tumor cell implantation. Tumor volume was measured via caliper every three days (n = 13–14). (C) Balb/c mice were intravenously injected with 1 × 10⁵ 4T1 cells. Tumor-bearing mice were treated with isotype control, anti-KLRG1 mAb, anti-PD-1 mAb or anti-KLRG1 + anti-PD-1 mAbs on day 7, 10, 13, and 16 post-tumor cell injection. Tumors were quantified macroscopically on day 21 post-tumor cell injection (n = 11–12). (Data are representative (A) or pooled from two experiments (B-C), error bars indicate S.E.M.) *p < .05, **p < .01, ***p < .001, and ****p < .0001.
Supplemental material