Figures & data
Figure 1. KRAS mutations are shared neoantigens. A. Summary of the peptides used to assess KRAS Radium TCRs specificities. These peptides represent various KRAS mutations found in the population. Mutation frequencies are based on.Citation33
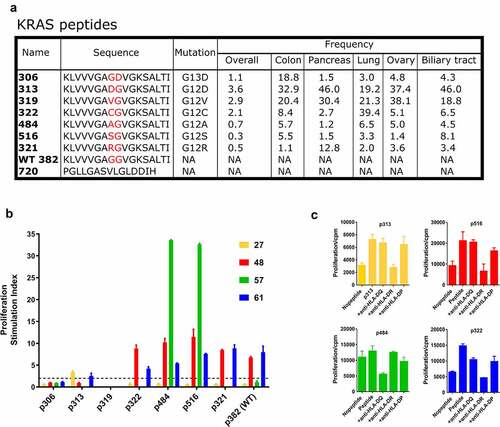
Figure 2. Isolated KRAS Radium TCRs are effectively expressed. A. Summary of KRAS TCR sequences. B. Expression of Radium-10, Radium-11, Radium-12 and Radium-13 after retroviral transduction into J76 cells, detected by anti-CD34 antibody, anti-CD3, and anti-Vβ specific for each TCR chain or anti-TCRαβ antibodies, as indicated. Radium-13 did not have a tCD34 tag. Data shown are representative flow diagrams of two independent experiments. C. TCR detection in primary T cells by staining with anti-CD34 or anti-Vβ3 antibodies. Data shown are representative flow diagrams from two or three independent experiments
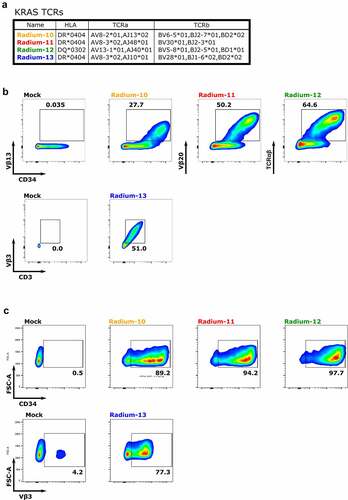
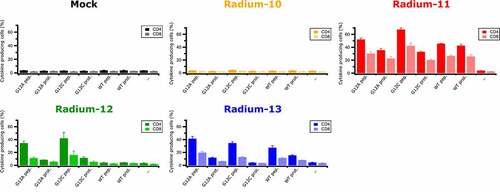
Figure 3. KRAS Radium TCRs recognize several KRAS mutations and promote specific killing of tumor targets. A. Heat maps representing the percentage of CD4+ and CD8+ KRAS Radium transduced T cells secreting cytokines (IFN-γ and TNF-α) upon co-culture with EBV-LCL cell lines loaded overnight with 10 µM of KRAS or hTERT peptides. Data shown are representative of two independent experiments. B. Bar graphs representing the ratio between the half peptide concentrations extracted from Supplementary Figure 1 and the maximum percentage of cytokine secreting cells obtained from Figure 2A. C. Cytotoxicity obtained by BLI-assay of effector T cells co-cultured with luciferase-expressing EBV-LCLs loaded or not with 10 µM of KRAS peptides. Data represent mean ± SD of triplicates
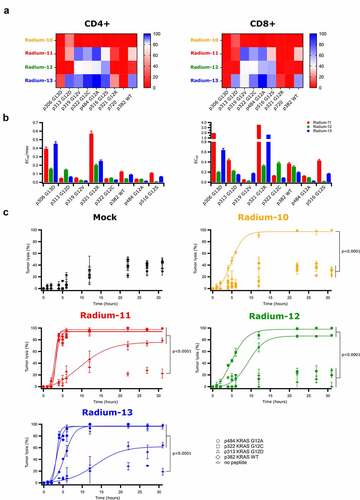
Figure 4. KRAS Radium TCRs recognize endogenously processed full length KRAS proteins. Intracellular IFNγ and TNFα production in Radium-10, −11, −12, −13 TCR transduced CD4+ and CD8+ effector T cells co-cultured with EBV-LCL cells loaded or not with 5 µM of KRAS proteins or 5 µM of peptides. Data represent mean ± SD of triplicates