Figures & data
Figure 1. ILK expression correlates with PRNP and is enriched in CMS4 CRC. a GSEA analysis showing enrichment of the Integrin binding, Cell substrate junction and Cell substrate adhesion signatures in the genes most correlated with PRNP expression in the CIT cohort. b Leading edge analysis highlighting ILK as an overlapping core gene in the three gene sets enriched in high PRNP expressing tumors of the CIT cohort. c Relative ILK gene expression in patients from the CIT cohort (top panel), validation cohort (middle panel) or PETACC8 cohort sample (bottom panel) within the 4 molecular subgroups according to the consensus classification.Citation2 NT indicates non-tumors controls. p < 2e-16 for CIT and validation cohorts and p = .0033 for PETACC8 cohort, respectively (ANOVA variance analysis). p < .0001 for CMS4 vs each other CMS for CIT and validation cohorts, p = .18, p = .002 and p = .067 for CMS4 vs CMS1, CMS2 and CMS3, respectively for PETACC8 cohort sample (Tukey post hoc test). d-e Analysis of ILK gene expression in the CIT cohort (top panels), validation cohort (middle panels) or PETACC8 cohort sample (bottom panels) demonstrates significant correlations (all p < . 00001) with mRNA expression of PRNP d or with the PRNP score e, defined as the sum of the expression of the 13 PrPC-dependent genes reported in.Citation5
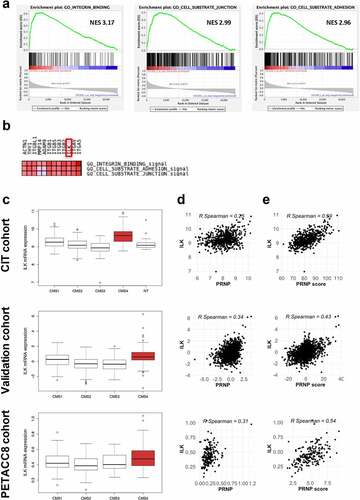
Figure 2. Prognostic impact of high ILK expression in CRC. a Kaplan-Meier overall survival (OS) (left panel) and relapse free survival (RFS) (right panel) according to high and low ILK gene expression was determined in the CIT cohort. b Kaplan-Meier OS (left panel) and RFS (right panel) comparing patients with high ILK and PRNP gene expression to other patients of the CIT cohort. Samples were grouped according to ILK and PRNP gene expression with a threshold corresponding to the 90th percentile of non-tumors samples. Hazard ratios in a and b were adjusted for sex, age at diagnosis, TNM stage and tumor location. c Kaplan-Meier OS (left panel) and disease free survival (DFS) (right panel) according to high and low ILK gene expression was determined in the PETACC8 cohort sample. d Kaplan-Meier OS (left panel) and DFS (right panel) comparing patients with high ILK and PRNP gene expression to other patients of the PETACC8 cohort sample. Median values of ILK and PRNP gene expression were used as thresholds. Hazard ratios in c and d were adjusted for age, sex, grade, TNM stage, MMR status, RAS mutation status and WHO performance
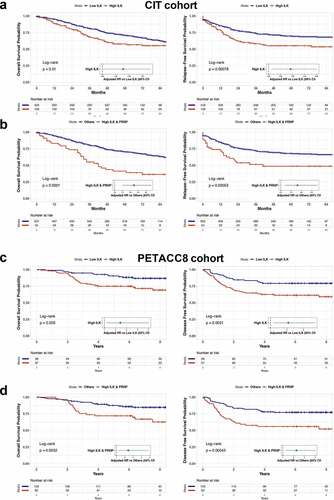
Figure 3. ILK is a target of PrPC in CRC cell lines and positively controls PrPC in a feedforward loop. a qRT-PCR analysis showing reduced expression of ILK in PRNP-silenced vs. control MDST8 cells. b Western blot analysis showing decreased expression of ILK in PRNP-silenced vs. control MDST8 cells. c qRT-PCR analysis showing increased expression of ILK in PrPC-overexpressing vs. control LoVo cells. d Western blot analysis showing increased expression of ILK in PrPC-overexpressing vs. control LoVo cells. e qRT-PCR analysis showing reduced expression of PRNP in QLT0267-treated (25 µM, 24 h) vs. control (DMSO-treated) MDST8 cells. f Western blot analysis showing decreased expression of PrPC in QLT0267-treated vs. control MDST8 cells. g Cell index measurements of PRNP-silenced vs. control MDST8 cells in proliferation/adhesion assay (E-plate, left panel), migration assay (CIMP-plate, middle panel) or invasion assay (Cultrex-coated CIMP-plate, right panel). h Cell index measurements of QLT0267-treated vs. control MDST8 cells in proliferation/adhesion assay (E-plate, left panel), migration assay (CIMP-plate, middle panel) or invasion assay (Cultrex-coated CIMP-plate, right panel). a-f Results are expressed as means of n = 2 independent triplicates of cell preparations ± s.e.m. (* p < .05, ** p < .01 and *** p < .001, two-tailed t test). g-h Graphs represent means of n = 4 replicates and are representative of n = 2 independent experiments
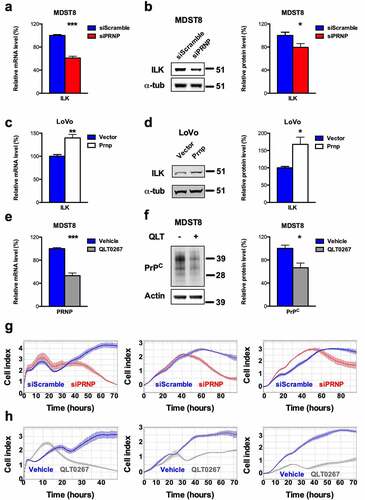
Figure 4. ILK is a major relay of PrPC downstream signaling. a Relative phosphoS518-NF2 to total NF2 protein ratio in a panel of CRC cell linesCitation18 as a function of their CMS classification,Citation19 p = .141 (Wilcoxon rank-sum test). b Western blot analysis showing reduced phosphoS518-NF2 protein expression and phosphoS518-NF2 to total NF2 ratio in PRNP-silenced vs. control MDST8 cells. c Western blot analysis showing reduced phosphoS518-NF2, total NF2, phosphoS518-NF2 to total NF2 and TAZ protein expression in QLT0267-treated vs. control MDST8 cells. d qRT-PCR analysis of PrPC-dependent genes in QLT0267-treated vs. control MDST8 cells showing reduced expression of CFL2, PDGFC, ITGA5, DDR2, ITGB5, CDH2, COL6A1 and ZEB1. e qRT-PCR analysis showing reduced expression of ILK in QLT0267-treated vs. control MDST8 cells. f Western blot analysis showing decreased expression of ILK in QLT0267-treated vs. control MDST8 cells. g Schematic diagram of the cascade linking PrPC, ILK and YAP/TAZ. b-f Results are expressed as means of n = 2 independent triplicates of cell preparations ± s.e.m. (* p < .05, ** p < .01 and *** p < .001, two-tailed t test)
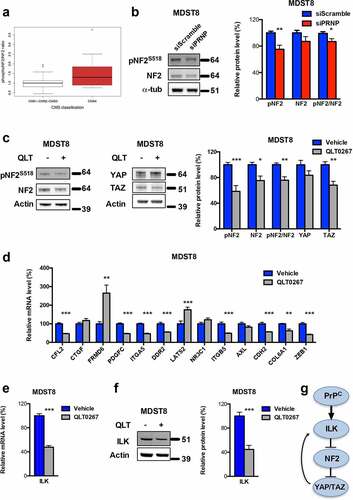
Figure 5. IDO1 is a downstream target of the PrPC-ILK axis. a qRT-PCR analysis showing reduced expression of IDO1 in PRNP-silenced vs. control MDST8 cells. b Reduced Kyn/Trp ratios in the supernatants of PRNP-silenced vs. control MDST8 cells. c Relative IDO1 mRNA expression in a panel of CRC cell linesCitation17 as a function of their CMS classification,Citation19 p < .0028 (Wilcoxon rank-sum test). d qRT-PCR analysis showing reduced expression of IDO1 in QLT0267-treated vs. control MDST8 cells. e Reduced Kyn/Trp ratios in the supernatants of QLT0267-treated vs. control MDST8 cells. f qRT-PCR analysis showing increased expression of TDO2 in PrPC-overexpressing vs. control LoVo cells. g Increased Kyn/Trp ratios in the supernatants of PrPC-overexpressing vs. control LoVo cells Results are expressed as means of n = 2 independent triplicates of cell preparations ± s.e.m. (* p < .05 and *** p < .001, two-tailed t test)
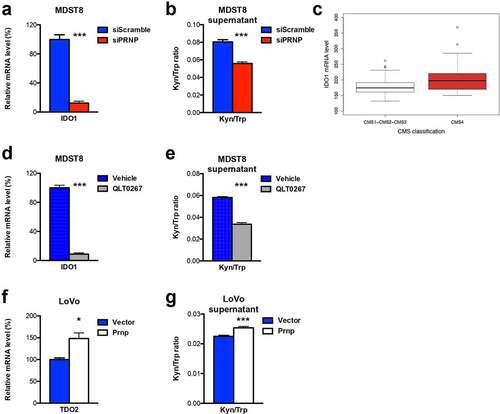
Figure 6. Trp metabolism is elevated in the plasma of mCRC patients, correlates with PrPC levels and has prognostic value. a-e Plasma levels of Trp a, Kyn b, Kyn/Trp ratios c, AA d and AA/Kyn ratios e measured in n = 275 healthy subjects and n = 325 patients with mCRC. p < 2e-16 for Trp, Kyn/Trp and AA and p = .0001 and p = . 0.0004 for Kyn and AA/Kyn, respectively (Wilcoxon rank-sum test). f-g Kyn/Trp ratios f and AA/Kyn ratios g plotted as a function of plasma PrPC levels in mCRC (n = 325 patients). Inserts show analysis restricted to samples with PrPC levels lower than 25 ng/mL. p < .0001 for all panels. h-o Forest-plots summarizing cox multivariate analyses of Trp low vs high samples h, Kyn high vs low samples i, Kyn/Trp high vs low samples j, AA low vs high samples k, AA/Kyn low vs high samples l, high PrPC-low Trp samples vs other samples m high PrPC-high Kyn samples vs other samples n and high PrPC-low AA samples vs other samples o. Dichotomization of patients by Trp, Kyn, Kyn/Trp, AA and AA/Kyn were at 28.1 µM, 1.24 µM, 0.0429, 47.6 nM and 0.03213, respectively. The threshold level for PrPC was 8.7 ng/mL, as in.Citation5 Analyses were carried out on all patients (n = 325) and adjusted on gender, Köhne criteria and primary tumor location
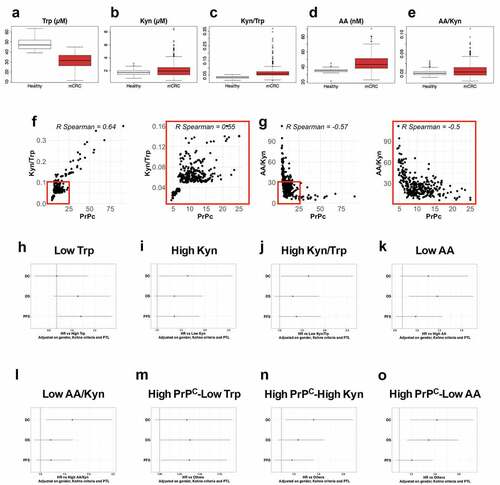
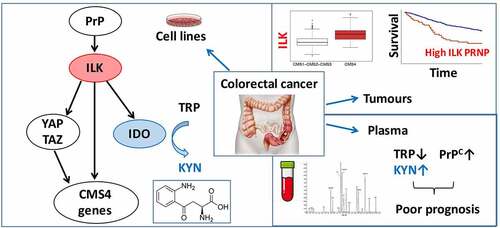
Figure 7. Schematic diagram. Molecular cascade linking PrPC with ILK and IDO1 and translational implications