Figures & data
Figure 1. Experimental design of adoptive cell transfer, TAT, and combination therapy
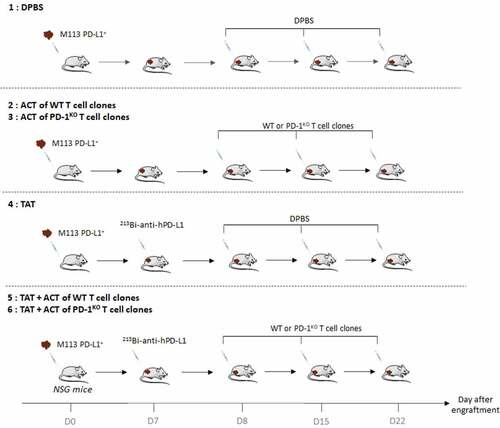
Figure 2. Anti-tumor efficacy of mono- and combination therapies. A. M113PD-L1+melanoma tumor growth curves in NSG mice receiving i.v. injection of DPBS (black circles), or monotherapy with either i.v. injections of 5 × 10⁶ of WT (gray circles, dotted line) or PD-1KO (yellow circles, dotted line) melanoma specific T-cells, or TAT (red circles, dotted line), or combination therapies with TAT and WT (gray circles, solid line) or PD-1KO T melanoma-specific T-cells (yellow circles, solid line). Table below the figure illustrates statistical comparisons performed using 2 way ANOVA, followed by Tukey multiple comparisons test. B. Individual curves of M113PD-L1+ melanoma tumor growth, in each group of NSG mice
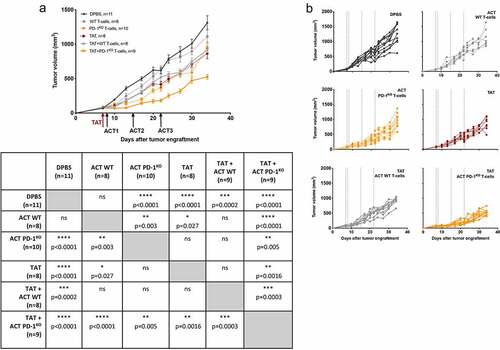
Figure 3. Hematologic and bone marrow toxicity after mono- and combination therapies. Platelet counts, RBC counts and plasma Flt3-Ligand concentrations were assessed at T0, before tumor engraftment and at end point, after treatment with DPBS (black boxes) or monotherapy with either i.v. injections of 5 × 10⁶ of WT (gray boxes) or PD-1KO (yellow boxes) melanoma specific T-cells, or TAT (striped red boxes), or combination therapies with TAT and WT (striped gray boxes) or PD-1KO T melanoma-specific T-cells (striped yellow boxes). Box extends from the 25th to 75th percentiles, line represents the median and the whiskers go down to the smallest value and up to the largest. Flt3-Ligand concentrations were assessed in duplicates. Statistical analyses were performed with two-way ANOVA followed by Sidak’s multiple comparisons test
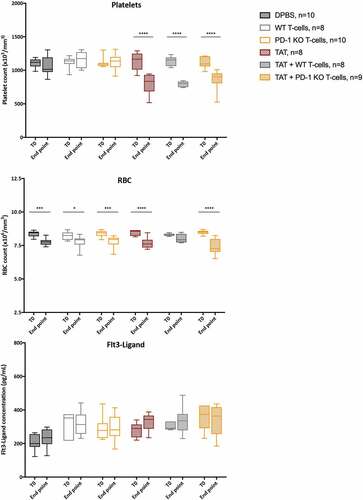
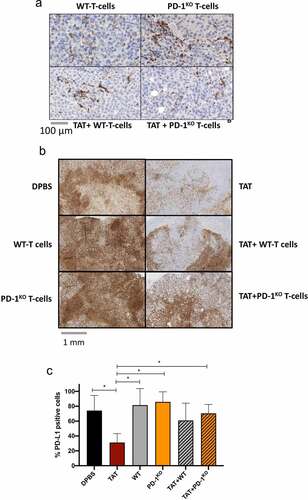
Figure 4. T-cell infiltration of melanoma tumors. A. Example of immunostaining of CD3 of melanoma tumors 60 hr after the third injection of T-cells. B. Example of PD-L1 staining of M113PD-L1+ tumors from mice from each treated group. C. Mean percentages of PD-L1+ cells, in tumors from each group (quantified with the Qupath open-source software). Statistical comparison was performed using multiple T-tests corrected using the Holm–Sidak method (Prism software). * p < .1