Figures & data
Table 1. Patient characteristics
Figure 1. Flow of the clinical trial
Table 2. Summary of adverse events
Table 3. List of all neutropenia events
Table 4. Summary of responses and survival
Figure 2. The swimmer plot shows the treatment response (RECIST 1.1) for subjects, noted with immune-related response criteria (irRC) listed aside. the plot is sorted by cohort and time on treatment. Note the subject B029 was a censored event as he was lost to follow up
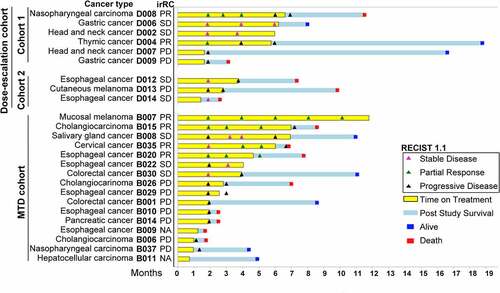
Figure 3. The spider plot shows measurement of target lesion of each subjects over time. all the measurements followed RECIST 1.1 criteria
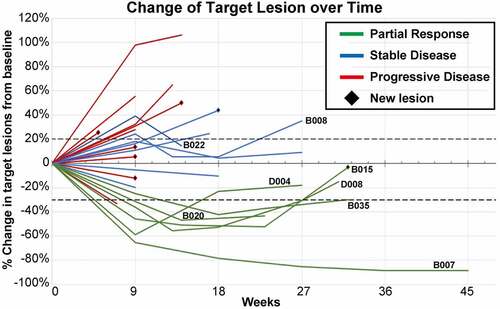
Figure 4. Pharmacodynamics and immunogenicity related to experimental drugs was measured. the level of arginine/citrulline level (left panel) and the anti-ADI-PEG 20 antibody titer (right panel) by time is summarized in dot-line plots. each dot represents mean levels of 25 patients with 25% and 75% percentiles (±SEM)
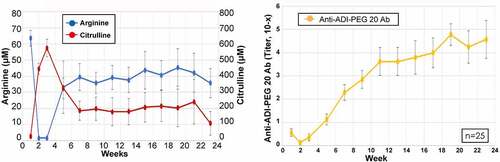
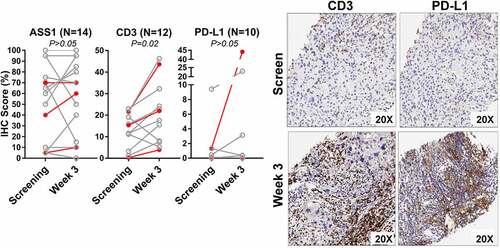
Figure 5. The paired immunohistochemistry results in tissue at screening and at week 3 biopsy are quantified in the dot-line plots (left panels). the subjects with response were labeled in red color. note that in CD3, there are four (33.3%) increase by >10%. representative CD3 and PD-L1 IHC images are from subject B015, a partial responder (right panels)