Figures & data
Table 1. Characteristics of patients with 16S rRNA gene amplicon-based analysis of the tonsillar microbiome in the tonsillar carcinoma and obstructive sleep apnea cohorts
Figure 1. Microbiome diversity in different tonsillar compartments of obstructive sleep apnea patients. (a) Schematic representation of the human palatine tonsil. The different sampling sites within the tonsil are indicated in gray (crypt), dark blue (epithelium) and bright blue (lymphoid tissue). (b-c) α-diversity in different sampling sites of OSA patients (n = 14 patients, only crypt samples have been available for patient 1). (b) Species richness measured in terms of observed number of species and Chao1 index. (c) Shannon and Simpson indices estimating species richness and evenness. (d-f) Principle coordinate analysis of the tonsillar microbiome in distinct sampling sites calculated using Bray–Curtis (d), UNIFRAC (e) and weighted UNIFRAC (f) distance metrics. Dots represent crypt, epithelial and lymphoid tissue biopsies of individual patients (n = 14 patients). Dotted circles represent superimposed normal probability over datapoints. (g) Bacterial community composition in different sampling locations of OSA patients at the phylum level. Statistical analysis does not reach significance (p < .05). Statistical analysis was performed using Kruskal–Wallis (b-c, g) or PERMANOVA (d-f) tests
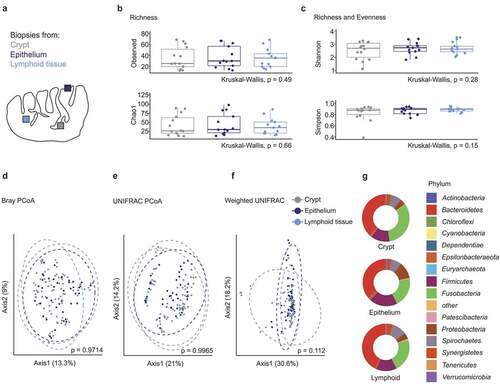
Figure 2. Microbial composition in ipsi- and contralateral tonsils of patients with obstructive sleep apnea. (a) Schematic representation of the oropharynx representing samples collected from right (dark blue) and left (bright blue) tonsils. (b-c) α-diversity displayed by observed number of species and Chao1 indices (b) and Shannon and Simpson indices (c). Dots represent crypt, epithelial and lymphoid tissue biopsies of individual patients (n = 14 patients). (d-f) Principle coordinate analysis calculated using Bray–Curtis (d), UNIFRAC (e) and weighted UNIFRAC (f) distance metrics. Samples of each patient are displayed by a distinct color. Dotted circles represent superimposed normal probability over data points. Statistical analysis was performed using Wilcoxon signed-rank test (b-c) or paired PERMANOVA (d-f) test
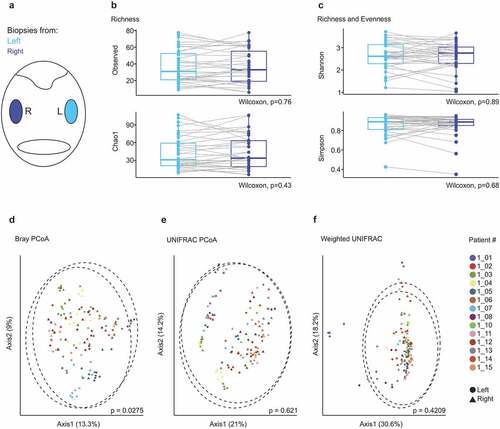
Figure 3. The tonsillar microbiome composition in tonsil cancer patients. (a) Schematic representation of the oropharynx illustrating crypt biopsies collected from tumor-affected and non-affected contralateral tonsils. (b-c) Comparison of α-diversity between tumor-affected and contralateral tonsils. Observed number of species, Chao1, Simpson and Shannon indices are shown. (d-f) Principle coordinate analysis using Bray–Curtis (d), UNIFRAC (e) and weighted UNIFRAC (f) distance metrics. Dotted circles represent superimposed normal probability over data points. (g) Taxonomic characterization of the microbiome in tonsil cancer patients on the phylum level. Statistical analysis does not reach significance (p < .05). (h) Relative abundance of the top eight highest abundant genera detected in tumor and contralateral tonsils. Statistical analysis was performed using Wilcoxon-Mann-Whitney test (b-c, g-h) or PERMANOVA test (d-f)
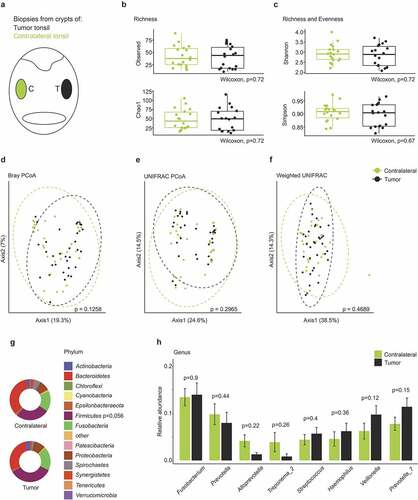
Figure 4. Comparison of the crypt microbiome in tonsil cancer and obstructive sleep apnea (OSA) patients. (a-b) α-diversity in crypt biopsies of OSA and tonsil cancer patients with (a) species richness assessed by the observed number of species and Chao1 index and (b) Shannon and Simpson indices indicating species richness and evenness. (c-e) Principle coordinate analysis using Bray–Curtis (c), UNIFRAC (d) and weighted UNIFRAC (e) distance metrics. Dotted circles represent superimposed normal probability over data points. (f) Bacterial community composition in tumor and OSA patient samples on the phylum level. Significant p-values from the statistical analysis are indicated. (g) Comparison of the top eight genera with the highest overall relative abundance. Statistical analysis was performed using Kruskall-Wallis (a-b, f), PERMANOVA test (c–e), or Wilcoxon-Mann-Whitney test (g) with *, p < .05; **, p < .01; ***, p < .001; ns, not significant
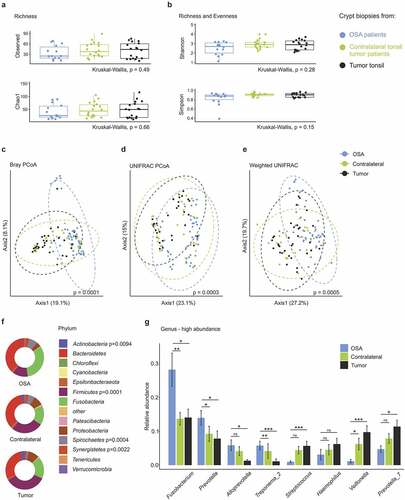
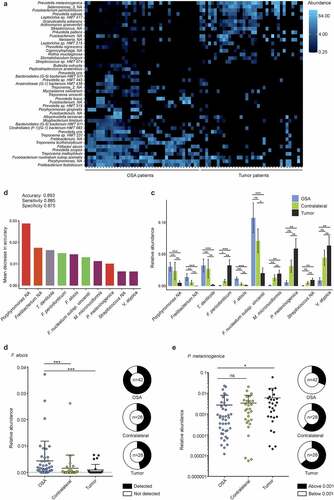
Figure 5. Characterization of tonsil cancer and obstructive sleep apnea (OSA) patient microbiomes at species level. (a) Heatmap showing top 45 differentially abundant species in crypts of tumor patients compared to OSA patients. (b) Mean decrease in accuracy of top ten tumor-predictive species calculated by means of random forest analysis. Bar color indicates phylum affiliation as used in Figure 4F of respective species. (c) Relative abundance of top ten predictive species plotted for tumor-bearing and contralateral tonsils of tumor and OSA patients. (d-e) Species specific quantitative PCR. Relative abundance of F. alocis (d) and P. melaninogenica (e) in samples from OSA and tumor patients. Statistical analysis was performed using Wilcoxon-Mann-Whitney test (c-e) with *, p < .05; **, p < .01; ***, p < .001; ns, not significant