Figures & data
Figure 1. Structural design and biochemical properties of bispecific T-cell engager CD123-CODV-TCE. (a) Proprietary CODV format that has a fully humanized IgG1 backbone with reduced Fc functionality. VH1/VL1 and VH2/VL2 correspond to CD3 and CD123 domains, respectively. CODV, cross-over dual-variable domain; Ig, immunoglobulin; TCE, T-cell engager; VH, Ig heavy chain variable domain; VL, Ig light chain variable domain; CH, Ig heavy chain constant domain; CL, Ig light chain constant domain; L, 10 amino acid linker. (b) CD123-CODV-TCE binds to human CD3 and CD123 proteins. Recombinant human CD3εδ and human CD123 were immobilized on a His capture sensor chip. Binding affinity of CD123-CODV-TCE to the respective antigens was measured by surface plasmon resonance using Biacore T200 (GE Healthcare Life Sciences, Marlborough, MA, USA) in multicycle kinetics experiments. After injecting each dilution of CD123-CODV-TCE of a 1:2 dilution series in assay buffer to measure the association kinetics, followed by an injection of buffer to measure the dissociation kinetics, the sensor surface was regenerated by inject of a regeneration solution. Sensorgrams were fitted using a 1:1 Langmuir interaction model to generate association rate constant, dissociation rate constant, and equilibrium dissociation rate constant values. Representative sensorgrams for binding of CD123-CODV-TCE to human CD3εδ and CD123 are presented. Data shown are means ± standard deviation from 3 independent experiments. CODV, cross-over dual-variable domain; TCE, T-cell engager
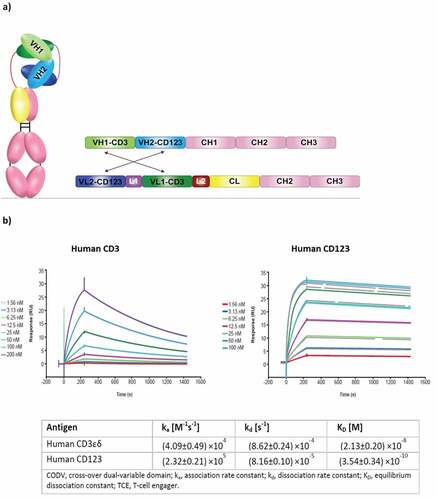
Table 1. CD123-CODV-TCE induces cytokine release in healthy donor whole blood: Major responding cytokines. Whole-blood derivatives from 26 human donors were incubated for 20 h with CD123-CODV-TCE (0.03–300 ng/ml) using the VaxDesign MIMIC® system (Sanofi Pasteur, Orlando, FL, USA), followed by assessment of 41 cytokines/chemokines in the supernatant with Bioplex® technology (Bio-Rad, Hercules, CA, USA). For each donor, each cytokine, and each treatment concentration, the fold change of cytokine concentration vs baseline concentration were calculated. Major responding cytokines are defined as cytokines for which the fold change from baseline is greater than 250-fold for at least 1 CD123-CODV-TCE tested concentration and 1 donor of 26. For these cytokines, the higher CD123-CODV-TCE concentration (ng/ml) producing less than 250-fold change for all the donors is reported
Figure 2. CD123-CODV-TCE mediates activation and cytotoxic activity of T cells against CD123-expressing THP-1 target cells and primary AML blasts in vitro. Isolated primary human T cells from healthy donors were seeded in the presence (solid black) or absence (dashed black) of THP-1 (E:T ratio 10:1) followed by incubation with CD123-CODV-TCE (0.025–2.5 nM) for 20 hours. (a) T-cell activation was assessed by measuring the CD69 expression in CD8+ or CD4 + T cells. (b) Cytotoxic activity was assessed by measuring the percentage of THP-1 cells staining for 7-amino-actinomycin D. Data presented are mean with SEM of 5 to 7 independent experiments. The solid gray line indicates the relative estimated concentration producing half effect (relEC50). (c) Flow cytometry CD123 expression of CD123 on THP-1 cells (anti-CD123-APC, Clone 7G3, BD Pharmingen #560087, Isotype IgG2a, κ, APC BD Pharmingen, # 555576). (d) Cytotoxic activity against primary human AML cells was evaluated in vitro. Unfractionated blood sample from human patient #378 and unfractionated bone marrow from the human patients #323, #132, and #11 were incubated with CD123-CODV-TCE or CD123 silenced-CODV-Fab control (0.025, 0.25, or 2.5 nM) or cell culture medium and assessed for apoptosis on day 0, 3, and 7 (black, blue, and green bars, respectively). Data shown are means with standard deviation of triplicates. AML, acute myeloid leukemia; CODV, cross-over dual-variable domain; E:T, effector to target; SEM, standard error of the mean
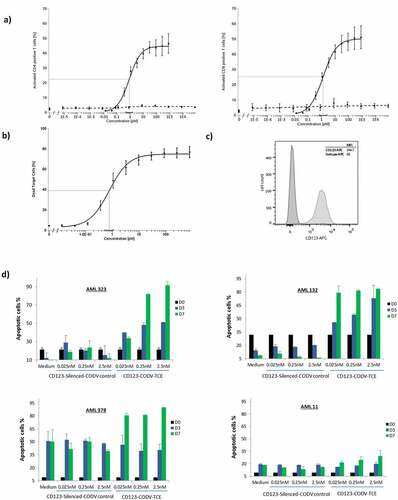
Table 2. Pharmacokinetic analysis in naive or Molm-13-luc/effector T cells-implanted NSG mice
Figure 3a. CD123-CODV-TCE induces anti-leukemic effect in Molm-13-luc AML xenograft model in vivo. CD123-CODV-TCE was administered at 1.64, 16.4, and 164 µg/kg IV on days 4, 7, 10, and 13 post-tumor implantations in NSG mice bearing disseminated Molm-13-luc CD123+ AML cells in presence of human effector T cells. Global and long-bone tumor growth was followed by in vivo terminal bioluminescence imaging. (a) illustrates anti-tumor activity of CD123-CODV-TCE at all tested doses corroborated by longitudinal quantitation of photon flux for whole body (b) and long bones (log scale) (c). Anti-leukemic effect of CD123-CODV-TCE in spleen, lung and liver tissues was assessed by terminal ex-vivo BLI imaging. Graphs represent individual bioluminescent signal values associated with the median value for each group of treatment. Medians with median absolute deviation were represented (d). Tumor regression in long bones was validated by bone hematoxylin eosin saffron terminal histology (HSE) (e)
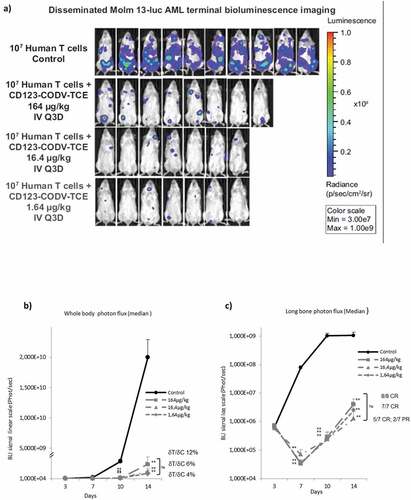
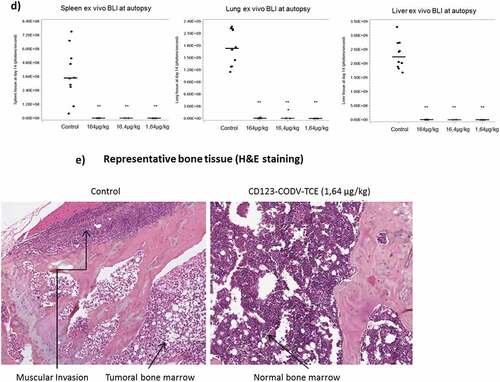
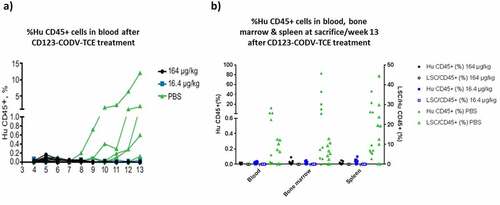
Figure 4. CD123-CODV-TCE depletes blast cells and LSCs in primary AML disseminated model in NSG mice in vivo. NSG mice were engrafted IV with whole blood from chemo-resistant AML patient #323. (a) AML engraftment was evaluated in each animal’s peripheral blood by ex-vivo flow cytometry using human CD45 as a marker. After week 9, tumor engraftment was detected only in the phosphate-buffered saline-treated control group. (b) At week 13, terminal detection by flow cytometry of the percentage of human CD45+ blast AML cells (left y-axis, solid dots), as well as the percentage of human LSCs (right Y-axis, empty dots) in blood, bone marrow, and spleen was determined. Blasts and LSCs were detected in peripheral blood, spleen, and bone marrow of control animals, but no LSCs or human CD45+ cells could be detected in these tissues in mice treated with CD123-CODV-TCE