Figures & data
Table 1. Clinico-pathological characteristics of 59 HNSCC patients and association with PD-L2 expression
Figure 1. Expression and distribution of PD-L2 in HNSCC specimens. (a) Representative immunohistochemistry (IHC) staining of PD-L2 in human HNSCC tumors. PD-L2 staining is negative if value is 0, weak if value is 1+, moderate if value is 2+, and strong if value is 3 + . Scale bar: 20 μm. (b) Comparing PD-L2 expression in different AJCC stages by Box plots. (c) Comparing PD-L2 expression in tumors with or without lymph node metastasis by Dot plots. (d) Correlation between the expression of intratumoural PD-L2 and PD-L1 using McNemar’s test. (e) Representative IHC staining of PD-L2 level in stromal cells. Comparison of PD-L2+ cells in intratumoural and stromal density using paired t tests. (f) Representative IHC staining of PD-L2 on a commercially purchased tissue microarray (HN803f, US Biomax) containing 61 primary and 8 metastatic HNSCC samples and 11 adjacent normal tongue specimens. (g) Differential expression of PD-L2 in normal tongue tissues, primary HNSCC specimens and metastatic HNSCC samples
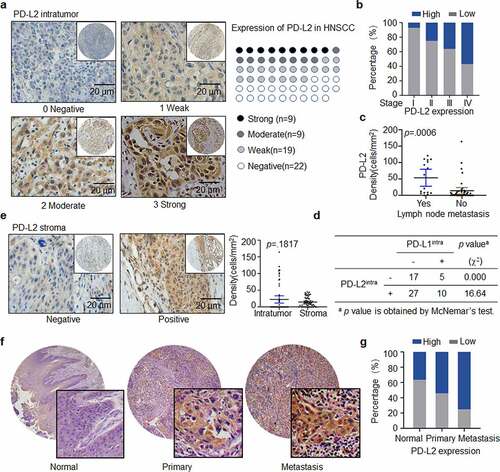
Figure 2. Heterogeneity of PD-1, PD-L1, and PD-L2 expression in HNSCC. (a) Correlation between cell density of PD-1-positive lymphocytes and TILs identified by CD8+ staining in HNSCC specimens. (b) Relation among cell density of PD-1+ TILs based on PD-L2 expression level. (c) Based on differential expression of PD-1, PD-L1 and PD-L2, the tumor microenvironment can be divided into four different types. (d) Representative immunohistochemical patterns of adaptive immune resistance with PD-1+, PD-L2+, CD8+, and PD-L1− cells
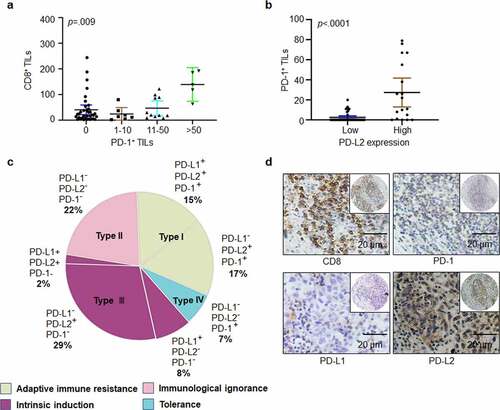
Table 2. Univariate analysis of overall survival factors
Table 3. Multivariate analysis of overall survival factors
Figure 3. PD-L2 plays a determined role in immunosuppression in vivo. (a) Efficacies of various monoclonal antibodies (mAbs) against murine HNSCC SCC7 cell xenograft tumors in vivo. SCC7 cells (approximately 5.0 × 10⁵) were injected subcutaneously on day 0, and treated with mAb on days 7, 9, 11 and 13. (b) Tumor growth was monitored twice a week (n = 7 per group). (c) Tumor weight was decreased in mice treated with PD-L2 mAb but not PD-L1 mAb. (d) Quantification of CD8+ IFN-γ+ in CD3+ T cell populations from isolated TILs using flow cytometry. (e) CD335+ NK cells detected by CD45 were examined. (f) CD3+ NKT cells detected by NK1.1 were examined. (g) Immunofluorescence staining showed the protein levels of CD8 and Granzyme B (GB) in SCC7 tumor masses. Scale bar: 20 µm. (h) Circulating tumor cell (CTC) enumeration in the peripheral blood of mice was determined by flow cytometry. The higher number of CTC was detected in PD-L1 mAb-treated mice than in the PD-L2 mAb group. *p < .05, **p < .01
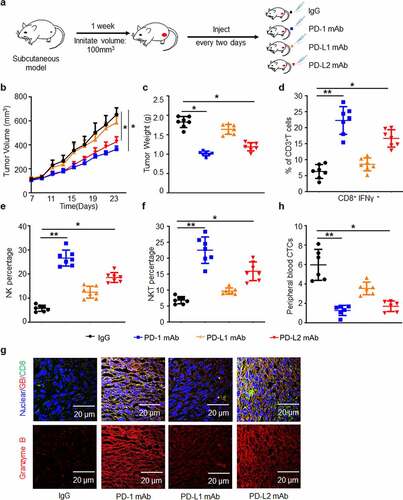
Figure 4. Immune marker expression in HNSCC. (a) Representative IHC staining of CD3, CD8 and FOXP3 in HNSCC specimens. Scale bar: 20 μm. (b) Paired t-test was used to compare the density of intratumoural CD3+, CD8+ and FOXP3+ cells in HNSCC. (c) Scatter plots with linear regression for intratumoural CD3, CD8 and FOXP3 levels using ANOVA test. (d) Scatter plots for intratumoural PD-L2 with CD3, CD8 and FOXP3 levels respectively using ANOVA test. (e) Relationship between CD3+, CD8+ and FOXP3+ TILs cell densities based on PD-L2 expression levels in tumor and stroma using the Kruskal–Wallis test
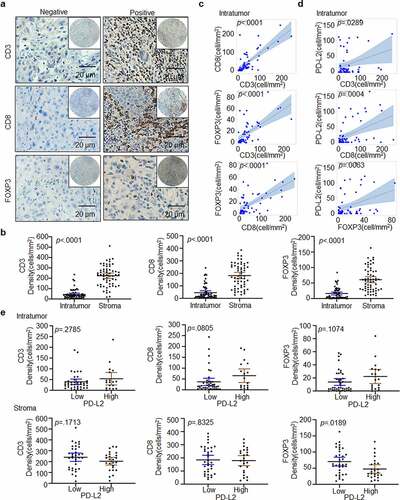
Figure 5. PD-L2-based immune signature correlates with survival of patients with HNSCC. (a) Kaplan-Meier method for overall survival (OS) based on intratumoural and stromal levels of PD-L2 and other immune markers. (b) Random survival tree analysis (STA) model using the variable of importance (VIMP) and minimal depth of prognostic variables in predicting OS. Longer VIMP bars with shorter minimal depth bars indicate a greater influence of the variable. (c) The variables selected by the STA model were used to generate a survival tree. (d) Waterfall plot of each prognostic index was drawn from the six nodes
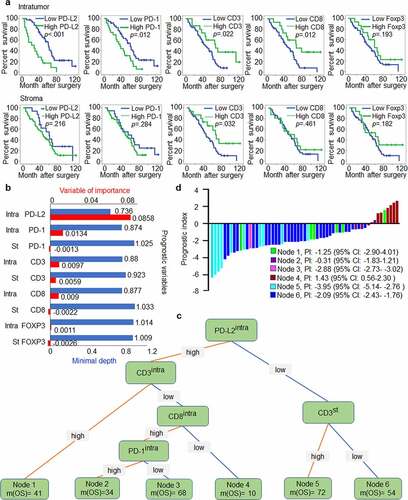
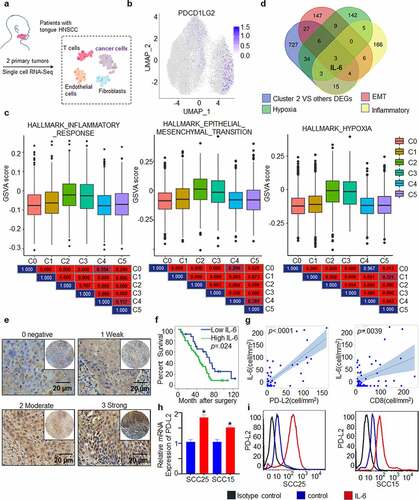
Figure 6. PD-L2 expression is associated with cytokine IL-6 expression. (a) Workflow shows collection and processing of fresh biopsy samples of primary tongue tumors for scRNA-seq. (b) Uniform manifold approximation and projection (UMAP) plot showing the distribution of expression of PD-L2 in cancer cells. (c) The status characterization of cluster 2. Boxplots showing the gene set variation analysis (GSVA) scores of each cell cluster for “HALLMARK_EPITHELIAL_MESENCHYMAL_TRANSITION”, “HALLMARK_ HYPOXIA” and “HALLMARK_ INFLAMMATORY_ RESPONSE”. P value was obtained by Wilcoxon rank-sum test. (d) IL-6 was overlapped in multiple PD-L2 related signaling pathways. (e) Representative IHC staining of IL-6 expression. Scale bar: 20 μm. (f) Kaplan-Meier curves for OS based on IL-6 expression. (g) Scatter plots for IL-6 and intratumoural PD-L2 and CD8 levels using ANOVA test. (h) Effect of IL-6 on intratumoural mRNA expression levels of PD-L2 in HNSCC cells as analyzed by RT-qPCR. (i) Flow cytometry analyses using PD-L2 mAb were performed to detect cell-surface PD-L2 expression in numerous human HNSCC cell lines