Figures & data
Table 1. Univariable and multivariable Cox regression for DFS
Figure 1. The expression status of nine detected immune-related proteins and their correlation
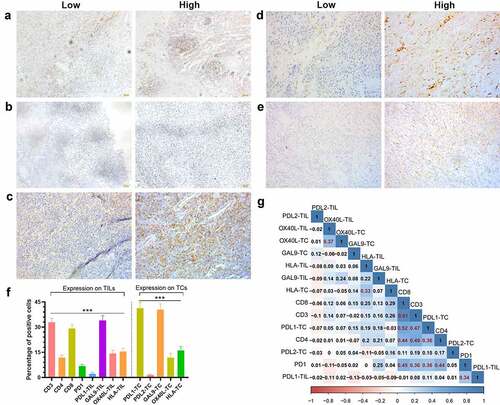
Figure 2. Kaplan–Meier survival curves with log-rank tests for DFS between patients with different levels of CD4 (a), PD-1 (b), Gal-9 on TC (c), and CD8 (d)
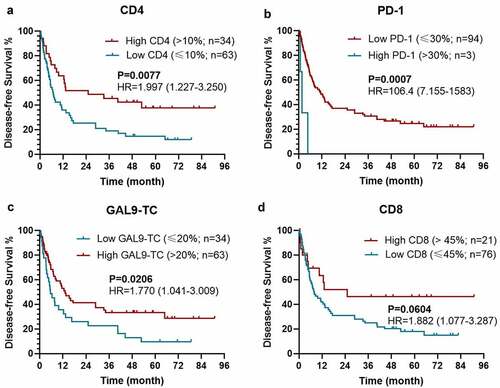
Figure 3. Kaplan–Meier survival curves with log-rank tests for OS between patients with different levels of CD4 (a), PD-1 (b), Gal-9 on TIL (c), HLA on TIL (d)
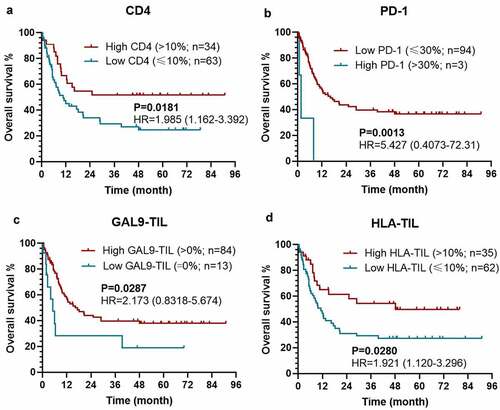
Figure 4. The performance of immune-based risk models for DFS. (a) The rank of relative importance of Gal-9 on TC, CD4, and PD-1 for DFS according to the random forest. The F1-score and AUC of CD4, PD-1, Gal-9, and the combination of the three proteins for 1 y- (b), 3-y (c), and 5-y DFS (d). The heights of the columns represent the average of 100 testing groups, and vertical lines represent the standard error of mean (SEM) of 100 testing groups. ***P < 0.001
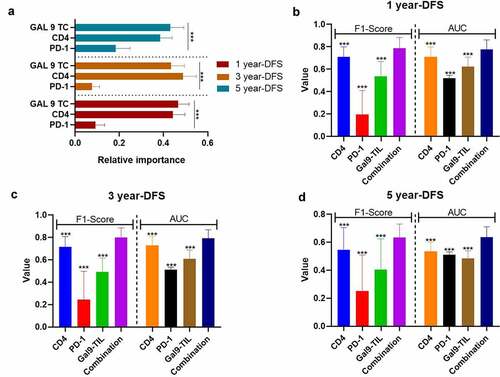
Figure 5. The performance of immune-based risk models for OS. (a) The rank of relative importance of Gal-9 on TIL, HLA on TIL, CD4, and PD-1 for OS according to the random forest. The F1-score and AUC of CD4, PD-1, Gal-9 on TIL, HLA on TIL, and the combination of the four proteins for 1 y- (b), 3-y (c), and 5-y OS (d). The heights of the columns represent the average of 100 testing groups, and vertical lines represent the standard error of mean (SEM) of 100 testing groups. *P < 0.05; **P < 0.01; ***P < 0.001; ns, not significant
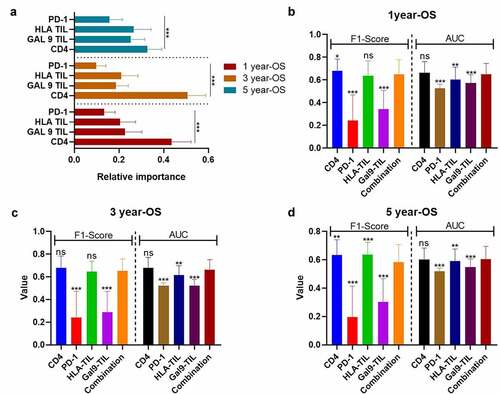
Figure 6. The improvement brought by the immune-based models to the TNM-Stage for the F1-Score (a) and AUC (b) of DFS predictions, and for the F1-Score (c) and AUC (d) of OS predictions. The heights of the columns represent the average of 100 testing groups, and dots represent the standard error (SE) of 100 testing groups. ***P < 0.001; ns, not significant
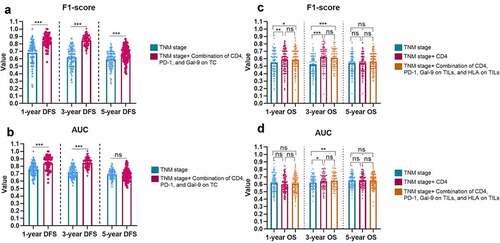
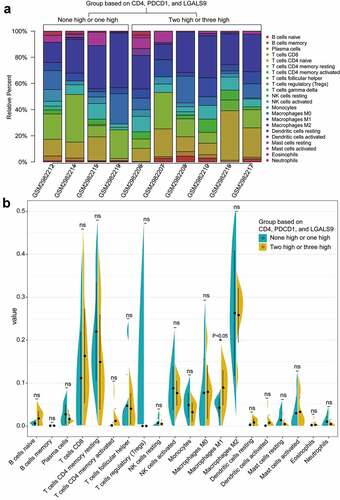
Figure 7. The enriched pathways and genes in the samples with a high level of CD4, PDCD1, and LAGLS9 by GESA. (a) The top four significant enrichment plots in samples with a high level of CD4, PDCD1, and LGALS9, compared with those in a low expression. (b) The heatmap of the overlap between subsets: the darker the color, the greater the overlap between the subsets. (c) The volcano map of the genes enriched in the group with high expression of CD4, PDCD1, and LGALS9 (ES>0.6 or ES<-0.6). The red dots and blue present the genes significantly downgraded and upgraded in the PSC samples compared with normal tissues, respectively (FDR<0.05, log2|fold change|>1). (d) The mRNA level of five DEGs between PSC and normal tissues. *P < 0.05
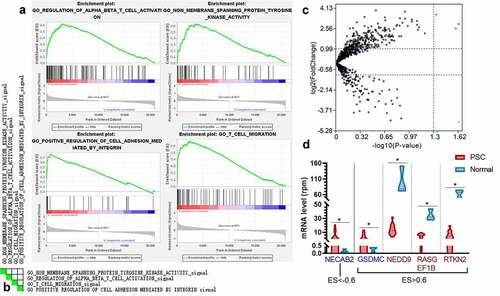
Figure 8. The landscapes of immune infiltration of the two groups with the low and high expression of CD4, PDCD1, LGALS9. (a) The stacked histogram of the proportion of 22 types of cells in ten PSC tissues with a P value<0.05 according to CIBERSORT. (b) The comparison of the percentage of each cell between the two groups in all samples. The black dots in the violins represent the mean of the group, and the vertical lines represent the standard of error (SE). *P < 0.05; ns, not significant