
Figures & data
Figure 1. Multicolor IHC shows increased T cell infiltrate and importance of spatial distribution in the tumor of complete responders
Multicolor IHC panel with CD3, CD8, FoxP3, CD163, Ki67 and CK on 39 pre-treatment biopsies is shown. Unsupervised clustering analysis of cell densities for both tumor and stromal regions in (a) displays two distinct clusters (A and B), with TRG score (1 to 5) and response (CR, nCR) color coded. Median cell densities (cells/mm2) were calculated and compared for CD3+CD8− and CD3+CD8+ cells in (b). Frequencies of CD8− and CD8+ T cells relative to CD3 are shown in (c) and the frequencies of proliferating (Ki67+) CD8− and CD8+ T cells are shown in (d). Densities for CD163+ myeloid cells and regulatory T cells (CD3+CD8−FoxP3+), as well as the frequency of proliferating (Ki67+) regulatory T cells are shown in (e). In (f) the CD3+CD8+Ki67+:CD163+ and CD3+:CD163+ ratios are shown. A CD3+:CD163+ ratio exceeding 1.0 is strongly associated with a favorable Mandard score. The distance (in µm) of T cells and proliferating T cells from CK+ tumor cells is shown in (g); cell numbers adjacent to CK+ tumor cells are shown in (h). Panel (i) are representative pictures of multicolor IHC images, with from left to right tumor infiltrating CD8− T cells, CD8+ T cells and a low CD3+:CD163+ ratio. * P < .05, ** P < .005, *** P < .001. All graphs show medians. Abbreviations: CR; complete responders, nCR; non-complete responders.
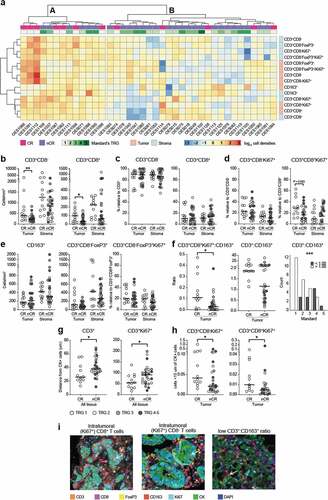
Figure 2. Flow cytometry on pre-treatment biopsies did not identify any response-specific immune signatures
Flow cytometry was performed on freshly processed pre-treatment biopsies. Patients were color coded based on TRG score (TRG 1 = CR, white circles; TRG2-5 = nCR; color-coded). Immune cell frequencies relative to CD45+ cells are shown for each patient in (a). The following markers were used: CD3 for T cells, CD19 for B cells, CD11b+ CD14+ HLADR− for mMDSC, CD11b+ CD14− CD15+ for gMDSC, CD14± CD15− for macrophages, further subdivided into M1-like (CD80+) and M2-like (CD163+), CD11 c− CD14high CD19− CD1c+ for DCs. Ratio of CD3+ to CD163+ cells (frequencies relative to live cells) with medians is shown in (b). Mann–Whitney U was performed, all P values were > 0.1.
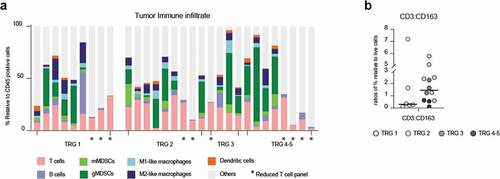
Figure 3. NanoString analysis shows an more cytotoxic cells complete responders than non-responders
NanoString gene expression analysis on mRNA from patients that were grouped based on TRG score: TRG1 = CR, TRG4-5 = NR. Cytotoxic cells relative to total leukocytes (TLs) are plotted by response (a). Th2 signature relative to T cells plotted by response (b) Volcano plot of the differential gene expression analysis, with genes with a log2 fold change between CRs and NRs greater than 1 or smaller than −1 highlighted in red (c). Gene set pathway scoring analyses (d).
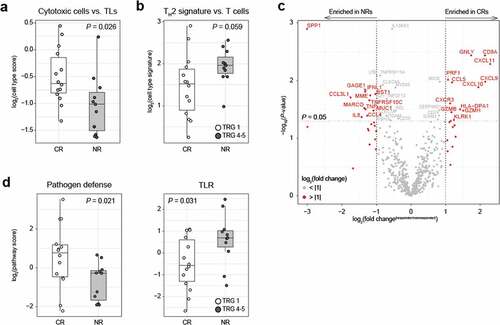
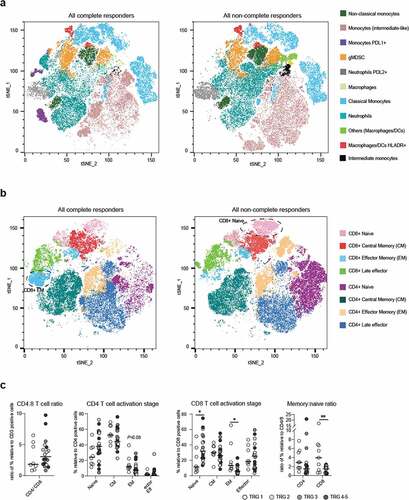
Figure 4. Flow analysis on circulating cells shows enriched CD8+ memory T cells in complete responders
Flow cytometry was performed on thawed PBMCs isolated from the blood of pre-treated patients, which were grouped based on TRG score (TRG 1 = CR, white circles; TRG 2–5 = nCR, color coded in grayscale); median is shown. The tSNE algorithm was performed on all samples for T cell panel and Myeloid panel following down-sampling (8,000 live cell events/sample) and concatenation. Next, FlowSOM was used to generate populations that were named based on MFI of fluorochromes used. tSNE plots of CR vs nCR showing the identified myeloid cell subsets (a). Markers: CD14hiCD16− classical monocytes, CD14low CD6+ non-classical monocytes, CD14+ CD16hi intermediate monocytes, CD16− CD14−/low/+ Macrophages and/or DCs, CD11b+ CD14− CD16− for gMDSC, CD16hi CD14− CD11b+ Neutrophils). tSNE plots of CR vs nCR are showing the memory status for both CD4+ and CD8+ T cells (b). Ratio of CD4:CD8 frequencies relative to CD3+ T cells, CD8 and CD4 T cell activation stage, relative to CD4/8+ T cells (markers: CD27+CD45RA+ naïve, CD27+CD45RA− CM, CD27−CD45RA− EM, CD27−CD45RA+ Effector) and ratio of memory (sum of CM+EM) and naïve cell % relative to CD4/8+ T cells are all shown in (c). *P < .05, **P < .005.
Supplemental material