Figures & data
Figure 1. Long term survivors to EBV-specific adoptive T cell therapy have higher TCR repertoire diversity without HLA bias. a. Comparison of Shannon entropy between LTS and STS for CDR3 regions. b. Comparison of Shannon entropy for full-length TCRs. c-h. Shannon entropy comparisons in subgroups. LTS and STS are subgrouped according to their HLA alleles or types. Each dot represents the Shannon entropy value of each patient’s CTL repertoire. P values were calculated using nonparametric Wilcoxon signed-rank test; *, p < .05. LTS, long term survivors; STS, short term survivors
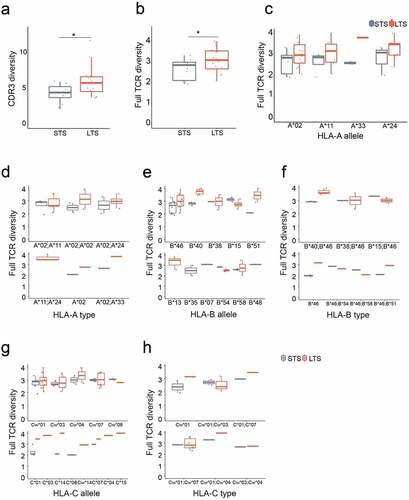
Figure 2. Long term survivors have lower inter-patient TCR repertoire similarity unrelated to HLA allomorphs. a-b. Similarity comparisons between LTS and STS for the CDR3 region. Each dot represents a Jaccard similarity value for a pair of LTS or STS. c. Similarity comparisons for full-length TCR. d. CDR3 similarity for top frequency clones. TCR clonotype analyses used 10%, 1%, and 0.1% clonotypes. e. Inter-patient HLA overlap in LTS and STS groups. The size of each dot represents the number of patient-matching pairs. P values were calculated using Pearson’s Chi-squared test. f. Correlation of inter-patient similarity versus the number of shared HLAs. P values were calculated using Wilcoxon signed-rank test; **, p < .01; ***, p < .001, ****, p < .0001; ns, not significant; LTS, long term survivors; STS, short term survivors
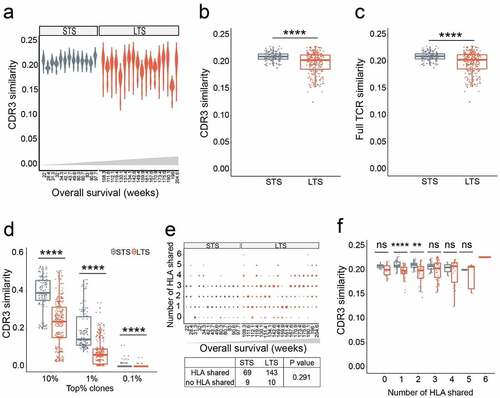
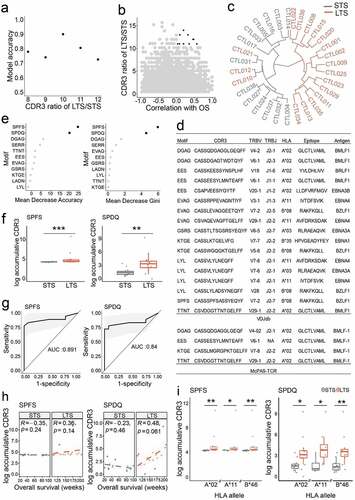
Figure 3. TCRβ CDR3 structural motifs predict clinical response. a. Model accuracy was applied to choose the optimal motif ratio in LTS and STS groups. The accuracy is valuated with the pool of motifs non-negatively correlated with overall survival. Number of X axis indicates greater than x. At a ratio of greater than 10, accuracy reached a maximum. b. Plot depicting LTS/STS CDR3 ratios and correlation with overall survival. The top candidates (highlighted in black) were chosen based on their positive correlation (≥0) and ratio ≥11. c. LTS were distinguished from STS by combining 11 CDR3 motifs. d. Motifs found in public databases. The 11 Motifs used to group patients were searched in VDJdb and McPAS-TCR databases. e. The indicated 11 CDR3 motifs were ranked according to their predictive accuracy. Left, mean decrease accuracy; right, mean decrease Gini. f. Enrichment of SPFS and SPDQ motifs in LTS. g. ROC curves of SPFS and SPDQ motifs indicate medium to high predictive power to distinguish between NR and R groups. h. Correlation between overall survival and accumulative frequency of CDR3 clonotypes bearing SPFS or SPDQ motifs. i. Correlation between HLA sharing and accumulative frequency of CDR3s bearing SPFS or SPDQ motifs. Statistics based on Wilcoxon signed-rank test; *, p < .05; **, p < .01; ns, not significant; LTS, long term survivors; STS, short term survivors