
Figures & data
Table 1. Clinical characteristics of individuals recruited into this study. Tumor grade refers to the WHO glioma grade, and IDH refers to the isocitrate dehydrogenase mutation, both of which were determined by a pathologist. * – data from this individual were not included in further analysis
Figure 1. Immune cell frequencies
a and b immunohistochemistry (IHC) based identification of myeloperoxidase (MPO) and CD14 expressing cells, respectively. A section from each tumor was stained for either MPO or CD14, images at 10x were taken from 5 different regions on each slide and the ratio of MPO/CD14 stain to the DAPI (nuclear stain) was determined using image analysis. Ratios (individual samples, and combined based on tumor grading) are shown in box plots. Images of three sections representing a low, medium and high ratio are shown as an inset in the graphs. Top panel of insets are images of IHC, and the bottom panel are digital conversions with pink representing the marker and blue nuclei for ease of viewing (enhanced contrast). In addition, percentages of CD15+ (neutrophils) and CD14+ (monocytes) cells determined by flow cytometry are shown below for comparison.c percentages of immune cell subsets in tumors determined via flow cytometry. Percentages are calculated as the proportion of each subset among total live cells. Cell types were determined using the following markers: CD45+ – all immune cells; CD15high – neutrophils; CD15med – other granulocytes (gran.); and CD14+CD15neg and CD14+CD15med as two monocyte subsets.d percentages of immune cell subsets in the blood. CD15high – neutrophils and CD14+CD15neg – monocytes. For statistical comparison of data, two-way ANOVA followed by Bonferroni’s test was performed. *** indicates p < .001. No significant difference was observed, if not indicated.
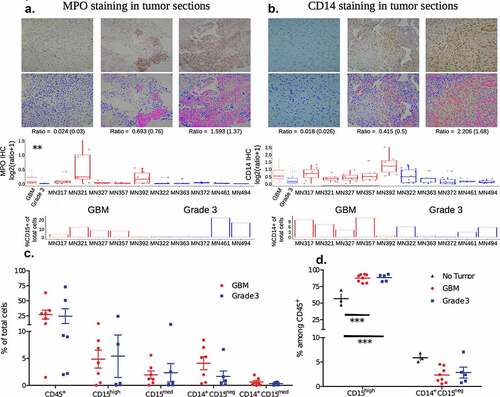
Figure 2. Clustering analysis of flow cytometry data
a Heatmap showing median fluorescence intensity (MFI) for all markers in five cell types in blood and tumor across No Tumor, GBM and Grade 3 IDHmutant subgroups. For comparison across different samples and batches the MFI values were z-scored sample-wise. CD14, CD15, and CD45 occur three times as they are common markers across all panels.b Box plots of four specific markers, CD36, CD16, CD66b, and CD282, across five cell types in blood and tumor tissue. The Welch’s two sample t-test was used to calculate p values.
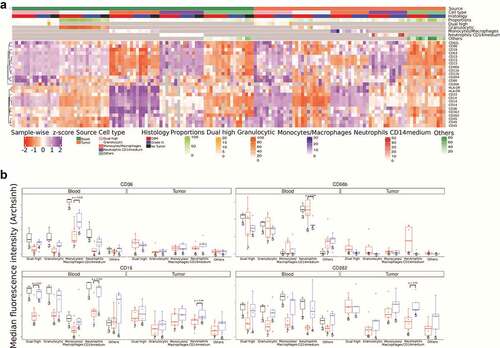
Figure 3. Neutrophil proteomics
a Bar plots showing protein levels in peripheral neutrophils collected from GBM patients pre and post dexamethasone treatment.b PCA plot of all neutrophil proteomics samples showing no clustering of pre and post dexamethasone treated neutrophil samples.
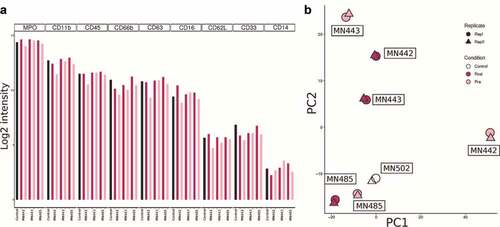
Figure 4. Expression of CD163
a Expression levels among the two subsets of monocytes present in tumors. Left panel measures expression as a percentage of cells that are positive for CD163. Right panel measures the expression as the median fluorescence intensity (MFI) of the total subset population. For statistical comparison of data, two-tailed Student’s “t” test using Welch’s correction was performed. p values are indicated in the figure.b Immunohistochemistry-based determination of CD163 expression in tumor sections. Similar to other IHC images, a number of images from each section was obtained to determine the ratio of CD163 expressing cells among total cells (determined by counting nuclei). Ratios (individual, and combined based on tumor grading) are shown in box plots. Images of three sections representing a low, medium and high ratio are shown as an inset in the graphs. The top panel of insets are images of IHC, and the bottom panel are digital conversions with pink representing the marker and blue nuclei for ease of viewing (enhanced contrast). In addition, for the sake of comparison, the percentage of CD163+ cells as determined by flow cytometry for each tumor sample is also shown. *** indicates p < .001 (ANOVA).c Expression among monocytes in blood was measured as either percentage positive or MFI. Significant differences were not observed between the three groups – one-way ANOVA.d Expression of CD163 among neutrophils and other granulocytes (gran.) in tumor, and neutrophils in the blood. Significant differences were not observed.
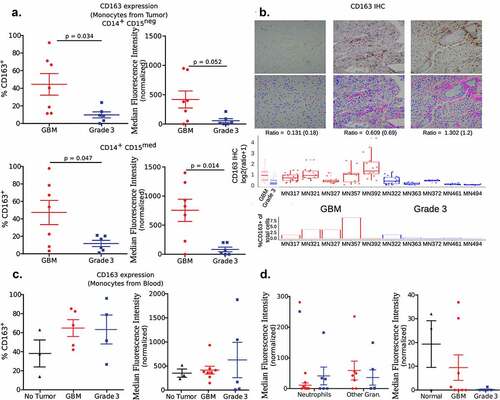
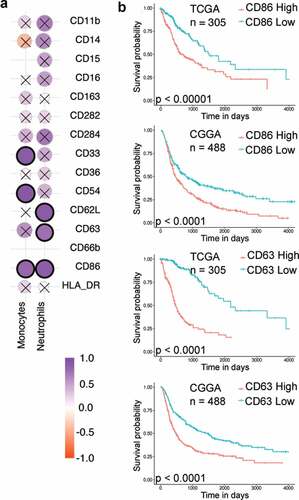
Figure 5. Correlation analysis
a Spearman’s correlation of surface protein expression levels (MFI) among neutrophils and monocytes in the blood and tumor. Correlation with p-value < 0.01 are highlighted in black circles.b Kaplan–Meier survival analysis for CD86 and CD63, markers showing correlation between blood and tumor values in both traditional flow cytometry analysis and single-cell analysis. Grade 3 with IDH mutation and GBM without IDH mutation samples from TCGA and CGGA data were used for this analysis. The samples were divided based on the median expression values of CD86 and CD63 genes.
Supplemental material