Figures & data
Figure 1. The mICAM1 and p15E SLPs show comparable reactivity against MOC22 tumor. (a) IFN-γ ELISPOT data for 5 × 10⁴ MOC22 CD8+ TILs (day 14) cultured with mICAM1 (TVYNFSAL) or p15E (KSPWFTTL) short peptides. N = 3 for each. Quantification shows the number of positive spots in each group. Unstimulated MOC22 TILs were used for the negative control (NC,) and PMA/ionomycin stimulated MOC22 TILs were used for the positive control (PC). Mann–Whitney U test was performed to analyze. (b) Representative flow cytometry plots of mICAM1 and p15E MHC-I tetramer staining against MOC22 TILs (day 14). The gated areas show percentage of tetramer-positive cells in CD45+CD8+ TILs. FMO: fluorescence minus one. (c) MHC-II specific epitope prediction for mICAM1 and p15E SLPs. Predictions were performed using NetMHCII 2.3 software. Pos: position, SB: strong binding candidate, WB: weak binding candidate. Underlined sequences represent predicted MHC-I epitopes. (d) Schematic of vaccine schedule. Each vaccine was performed on days −7, −5, and splenocytes were harvested on day 0. IFN-γ stimulated (100 U/mL, 48 h) 1 × 10⁵ MOC22 were mixed with (e) 5 × 10⁵ (ELISPOT) or (f) 1 × 10⁶ (ELISA) splenocytes per well from vaccinated WT mice and cultured for 24 h. VAC: vaccination. (E) IFN-γ ELISPOT data (n = 5 mice for each group). Quantification shows the number of positive spots in each group. one-way ANOVA was performed for multiple analyses. (F) IFN-γ ELISA assay data (n = 5 mice for each group). Kruskal–Wallis test was performed for multiple analyses
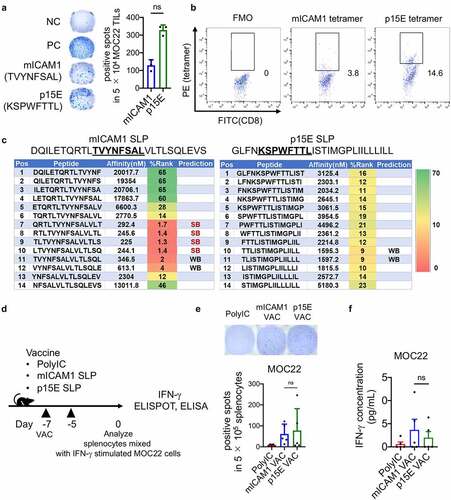
Figure 2. The mICAM1 and p15E SLPs both show preventive anti-cancer effects against MOC22. (a) Schematic of prophylactic vaccination schedule. Each vaccine was performed on days −7, −5, and 1 × 10⁶ of MOC22 cells were inoculated on day 0. VAC: vaccination, DLNs: draining lymph nodes. (b-c) IFN-γ ELISPOT analysis of (b) purified 3 × 10⁵ CD8+ and (c) purified 5 × 10⁵ CD4+ T cells per well from vaccinated WT splenocytes (n = 5 mice for each group). Quantification shows the number of spots in each group. Kruskal–Wallis test was performed for analyses. Short peptides (mICAM1:TVYNFSAL or p15E:KSPWFTTL) were used for stimulating (B) CD8+ T cells, SLPs (mICAM1:DQILETQRTLTVYNFSALVLTLSQLEVS or p15E: GLFNKSPWFTTLISTIMGPLIILLLILL) were used for stimulating (C) CD4+ T cells. The underlined sequences represent MHC-I epitopes of SLPs. (d) Flow cytometry analysis for CD45+CD11c+CD8α+ cDC1s in draining lymph nodes (DLNs) (n = 5 mice for each group). One-way ANOVA test was performed to analyze. (e) Mean fluorescent intensity (MFI) of CD80 and CD86 of cDC1s in DLNs from vaccinated mice (n = 5 mice for each group). Kruskal–Wallis tests were used for multiple analyses. (f) Tumor volumes in prophylactic poly(I:C) (control) and mICAM1 or p15E SLPs vaccinated groups (n = 10 tumors for each group). Data was analyzed with one-way ANOVA. CR: complete response. (g) Kaplan–Meier survival analysis of each prophylactic vaccinated group (n = 5 mice per group)
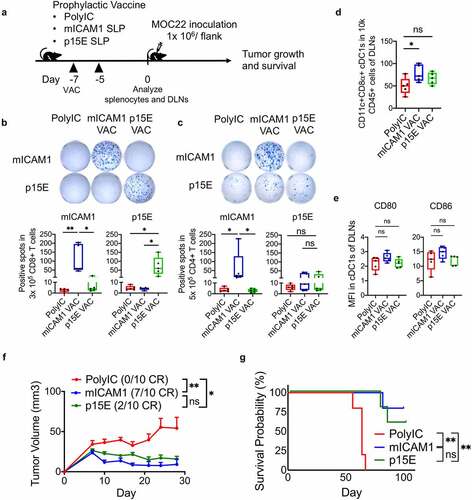
Figure 3. The mICAM1 SLP vaccination showed more significant therapeutic vaccination impact on MOC22 tumors than p15E SLP vaccine. (a) Schematic of therapeutic vaccination protocol. Each vaccine was performed on days 3,5,7,9, and 5 × 10⁶ of MOC22 were inoculated on day 0. VAC: vaccination. (b) IFN-γ ELISA assay for splenocytes harvested on day 12 using therapeutic vaccine protocol stimulated with mICAM1 (TVYNFSAL) and p15E (KSPWFTTL) short peptides for 24 h before analysis (n = 5 mice per group). Kruskal–Wallis tests were performed. (c-d) IFN-γ ELISPOT assays for purified (c) 3 × 10⁵ CD8+ or (d) 5 × 10⁵ CD4+ T cells per well from splenocytes of vaccinated MOC22 tumor-bearing mice. T cells were stimulated with each peptide (for CD8+ T cells; mICAM1:TVYNFSAL or p15E:KSPWFTTL, for CD4+ T cells; mICAM1:DQILETQRTLTVYNFSALVLTLSQLEVS or p15E: GLFNKSPWFTTLISTIMGPLIILLLILL). The Underlined sequences represent MHC-I epitopes in SLPs. N = 10 mice per group were used in two independent experiments. Quantification shows the ELISPOT positive numbers of each group. Kruskal–Wallis tests were performed for multiple analyses. (e) Tumor volumes in poly(I:C) (control) and mICAM1 or p15E SLPs vaccinated mice (n = 10 tumors for each group). Data were analyzed with one-way ANOVA. CR: complete response. (f) Kaplan–Meier survival analysis of each therapeutic vaccinated group (n = 7 mice per group)
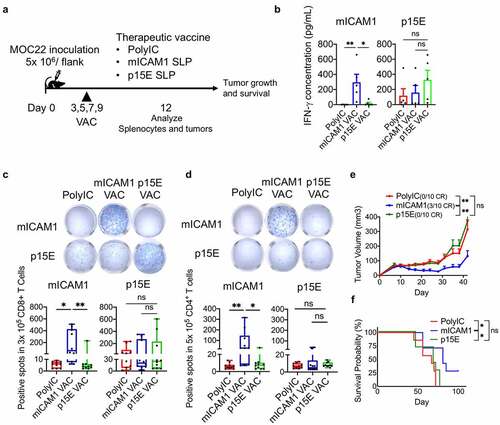
Figure 4. The mICAM1 SLP vaccination showed robust anti-cancer efficacy through prolonged IFN-γ production. (a) Schematic of therapeutic vaccination. MOC22 Tumors were analyzed on day 12 and 35. VAC: vaccination. (b) Flow cytometry analysis for CD45+CD11c+DCs in MOC22 tumors on day 12 (n = 10 tumors for each group). One-way ANOVA test was performed for analysis. (c) Mean fluorescent intensity (MFI) for CD80/ CD86 of DCs in MOC22 tumors on day 12 (n = 10 tumors for each group). One-way ANOVA tests were performed for analysis. (d) The mICAM1 and p15E MHC-I tetramer-positive rate in vaccinated CD45+CD8+ MOC22 TILs on day 12 (n = 6 for each group) and day 35 (n = 5 for each group) from therapeutic vaccinated mice and representative flow cytometry plots. Data were analyzed with Mann–Whitney U test. (e) ELISPOT assay of MOC22 TILs from therapeutic vaccinated mice on day 35. TILs were collected from 5 mice for each group, then divided into 5 × 10⁴ each well (n = 4 for each group) and stimulated with mICAM1 (TVYNFSAL) and p15E (KSPWFTTL) short peptides
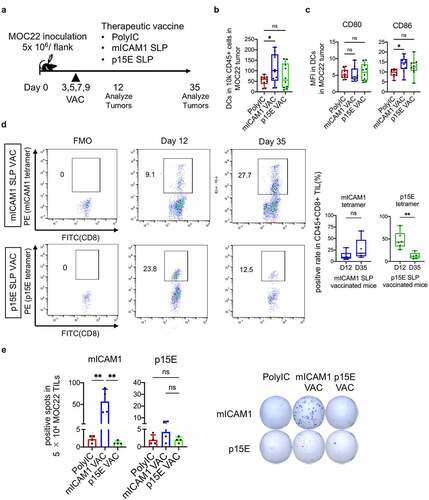
Figure 5. CD4+ and CD8+ T cells are both required for therapeutic MOC22 control. (a) A schematic illustration of CD4 or CD8 depletion in mICAM1 SLP vaccinated mice. Depletion antibodies were injected on days −1,6,13,20,27 and vaccines were performed on days 3,5,7,9. 5 × 10⁶ of MOC22 were inoculated on day 0. VAC: vaccination. (b) Average MOC22 tumor volumes in IgG plus poly(I:C), IgG plus mICAM1, anti-CD4 plus mICAM1, anti-CD8 plus mICAM1 and anti-CD4/CD8 plus mICAM1 conditions (n = 10 tumors per group). Data were analyzed with one-way ANOVA. (c) A schematic illustration of CD40L depletion in mICAM1 SLP vaccinated mice. Depletion antibodies were injected on days −1,6,13 and vaccines were performed on days 3,5,7,9. 5 × 10⁶ of MOC22 were inoculated on day 0. VAC: vaccination. (d) Average MOC22 tumor volumes in IgG plus poly(I:C), IgG plus mICAM1, anti-CD40L plus poly(I:C), anti-CD40L plus mICAM1 (n = 10 tumors per group). Data were analyzed with one-way ANOVA. CR: complete response. (e) ELISPOT assay of day 35 MOC22 TILs from IgG plus poly(I:C), anti-CD40L plus poly(I:C), IgG plus mICAM1, anti-CD40L plus mICAM1 treated mice. TILs were collected from 5 mice for each group, then divided into 5 × 10⁴ each well. TILs were stimulated with mICAM1 (TVYNFSAL) peptide
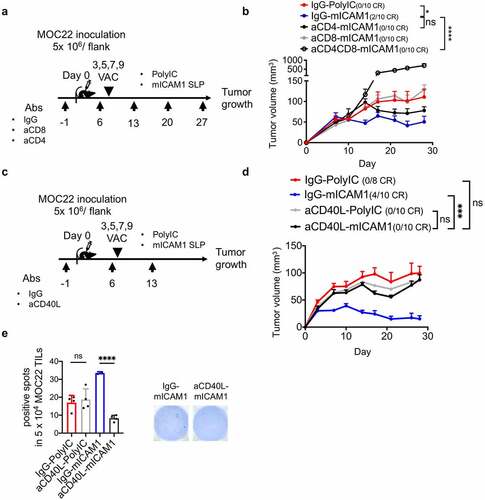
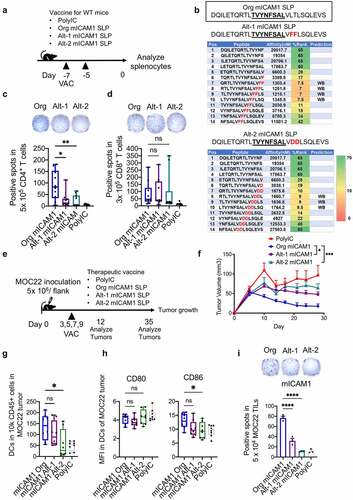
Figure 6. The mICAM1 specific MHC-II epitopes are indispensable for anti-cancer immunity in MOC22. (a) A schematic schedule of vaccination protocol for WT mice. VAC: vaccination. Org: original, Alt: altered. (b) Altered mICAM1 SLPs sequence and predicted affinity level with MHC-II using NetMHCII 2.3 software. Amino acids in red were altered. The underlined sequence represents MHC-I epitope. (c-d) ELISPOT quantification showing the number of IFN-γ positive spots of mICAM1-specific CD4+/CD8+ T cells from splenocytes of each vaccinated mouse (n = 10 mice for each group from two independent experiments). One-way ANOVA was used for analysis. (c) Purified 5 × 10⁵ CD4+ T cells per well were stimulated with Org mICAM1 SLP (DQILETQRTLTVYNFSALVLTLSQLEVS). (d) Purified 3 × 10⁵ CD8+ T cells per well were stimulated with mICAM1 short peptide (TVYNFSAL). (e) Schematic of therapeutic vaccination schedule with Org mICAM1, Alt-1 mICAM1, and Alt-2 mICAM1 SLPs. 5 × 10⁶ of MOC22 were injected on day 0. VAC: vaccination. (f) Average tumor volumes in poly(I:C) control, Org mICAM1, Alt-1 mICAM1, and Alt-2 mICAM1 SLPs vaccinated MOC22 tumor-bearing mice, respectively (n = 8 tumors poly(I:C), n = 10 tumors in other groups). Tumor volumes were analyzed with one-way ANOVA. (g) The number of CD45+CD11c+ DCs in MOC22 tumors on day 12 (n = 8 tumors for each group). (h) The mean fluorescent intensity (MFI) of CD80/CD86 in DCs in MOC22 tumors on day 12 (n = 8 tumors for each group). (i) Representative ELISPOT image of MOC22 TILs from vaccinated mice on day 35 and quantitation (Triplicate assay from mixed TILs in 5 mice for each group). TILs were stimulated with mICAM1 (TVYNFSAL) peptide. One-way ANOVA was performed to analyze