
Figures & data
Table 1. Patient characteristics
Figure 1. IL2, MIF and other cytokines are potential diagnostic markers for patients with PDA
(A) Heatmap comparing serum cytokine levels of PDA patients (n = 48) and healthy individuals (n = 30).(B) Scatter dot plot comparing serum cytokine concentration (left: IL2, right: MIF) of PDA patients (n = 48) and healthy individuals (n = 30).*p ≤ 0.05, **p ≤ 0.005, ***p ≤ 0.0001.IL2 = Interleukin 2MIF = Macrophage migration inhibitory factorPDA = Pancreatic ductal adenocarcinoma
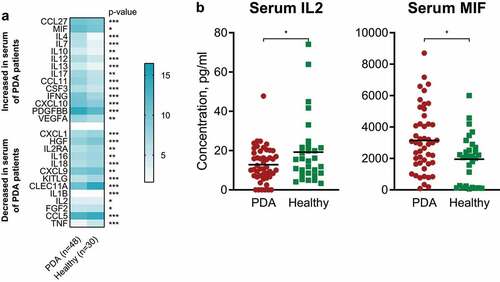
Figure 2. Circulatory IL2 and MIF are associated with poor overall survival
(A) Forest plot of serum cytokine levels and overall survival of PDA patients (n = 48).(B) Kaplan-Meier survival plots of PDA patients with high versus low serum concentration of IL2 (n = 24/n = 24). The median cutpoints were determined to stratify patients into high and low.(C) Kaplan-Meier survival plots of PDA patients with high versus low serum concentration of MIF (n = 24/n = 24). The median cutpoints were determined to stratify patients into high and low.*p ≤ 0.05IL2 = Interleukin 2MIF = Macrophage migration inhibitory factorPDA = Pancreatic ductal adenocarcinoma
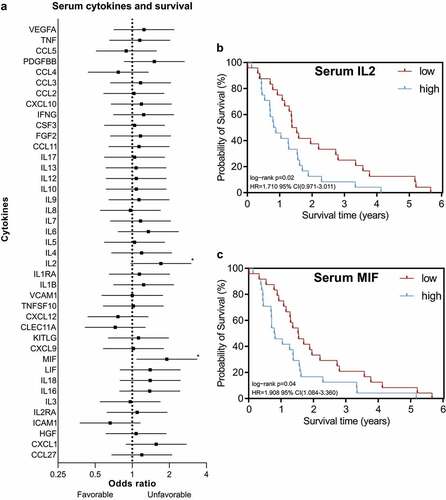
Figure 3. Tumor-to-Serum gradient of IL2 and MIF and their relationship to the tumoral immune landscape
(A) Comparison of serum and corresponding tumoral cytokine concentrations (left: IL2, right: MIF) of PDA patients with stratification in low and high serum concentration groups (n = 24/n = 24) (as indicated). The median cutpoints were determined to stratify patients into high and low.(B) Scatter dot plot comparing the tumoral expression of cytokines (left: IL2, right: MIF) of PDA patients with stratification in low and high serum concentration groups (n = 24/n = 24) (as indicated). The median cutpoints were determined to stratify patients into high and low.(C) Scatter dot plot comparing intratumoral quantities of immune cells (as indicated) in PDA patients with stratification in low and high serum cytokine concentration groups (as indicated). The median cutpoints were determined to stratify patients into high and low.*p ≤ 0.05, ***p ≤ 0.0001.IL2 = Interleukin 2MIF = Macrophage migration inhibitory factorPDA = Pancreatic ductal adenocarcinoma
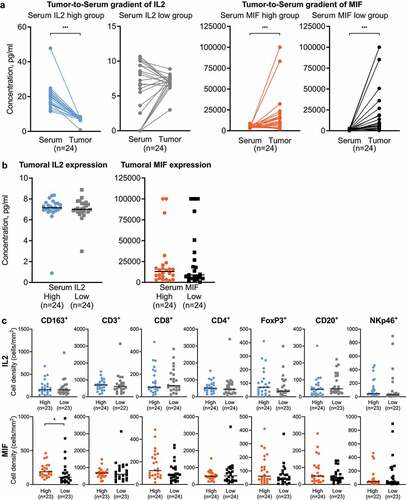
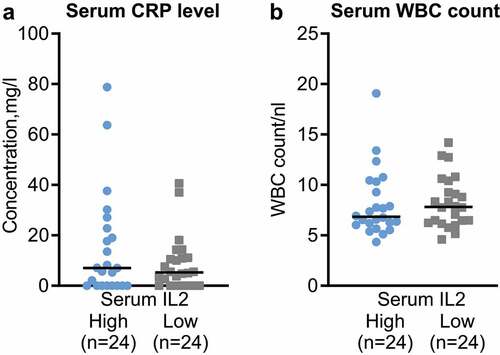
Figure 4. Increased IL2 levels are not associated with systemic inflammation markers
(A) Scatter dot plot comparing serum CRP levels of PDA patients with stratification in low and high serum IL2 groups (n = 24/n = 24). The median cutpoints were determined to stratify patients into high and low.(B) Scatter dot plot comparing serum WBC levels of PDA patients with stratification in low and high serum IL2 groups (n = 24/n = 24). The median cutpoints were determined to stratify patients into high and low.IL2 = Interleukin 2CRP = C-reactive proteinPDA = Pancreatic ductal adenocarcinomaWBC = White blood cell
DATA AVAILABILITY STATEMENT
All data are available upon request from the authors. All data relevant to the study are included in the article.